

Dividend yield vs payout ratio is a comparison of two denominators. Dividend yield relates an annual dividend to the share price. The payout ratio relates dividends to earnings. The percentages answer different questions, even when both start with the same dividend amount.
A three-state example shows why either ratio can rise without the company paying a larger dividend. Keep the input figures visible, and a percentage change becomes easier to explain without turning it into a claim about future income or investment quality.
Dividend yield vs payout ratio: identify the denominator
Dividend yield = annual dividend per share ÷ share price × 100. The FINRA Foundation dividend lesson supplies this current-price formula. It is used here solely for the stable arithmetic, not its historical market commentary.
Dividend payout ratio = dividends attributable to the relevant shares ÷ matching earnings × 100. BDC’s payout-ratio definition compares dividends with earnings after tax. A per-share calculation can use dividend per share divided by earnings per share when the share basis is consistent.
Write the question beside each ratio: “How large is the stated annual dividend relative to this price?” for yield; “How large is the distribution relative to these earnings?” for payout. Neither formula asks what a shareholder’s complete holding-period return was.
Dividend yield vs payout ratio: a fictional company example
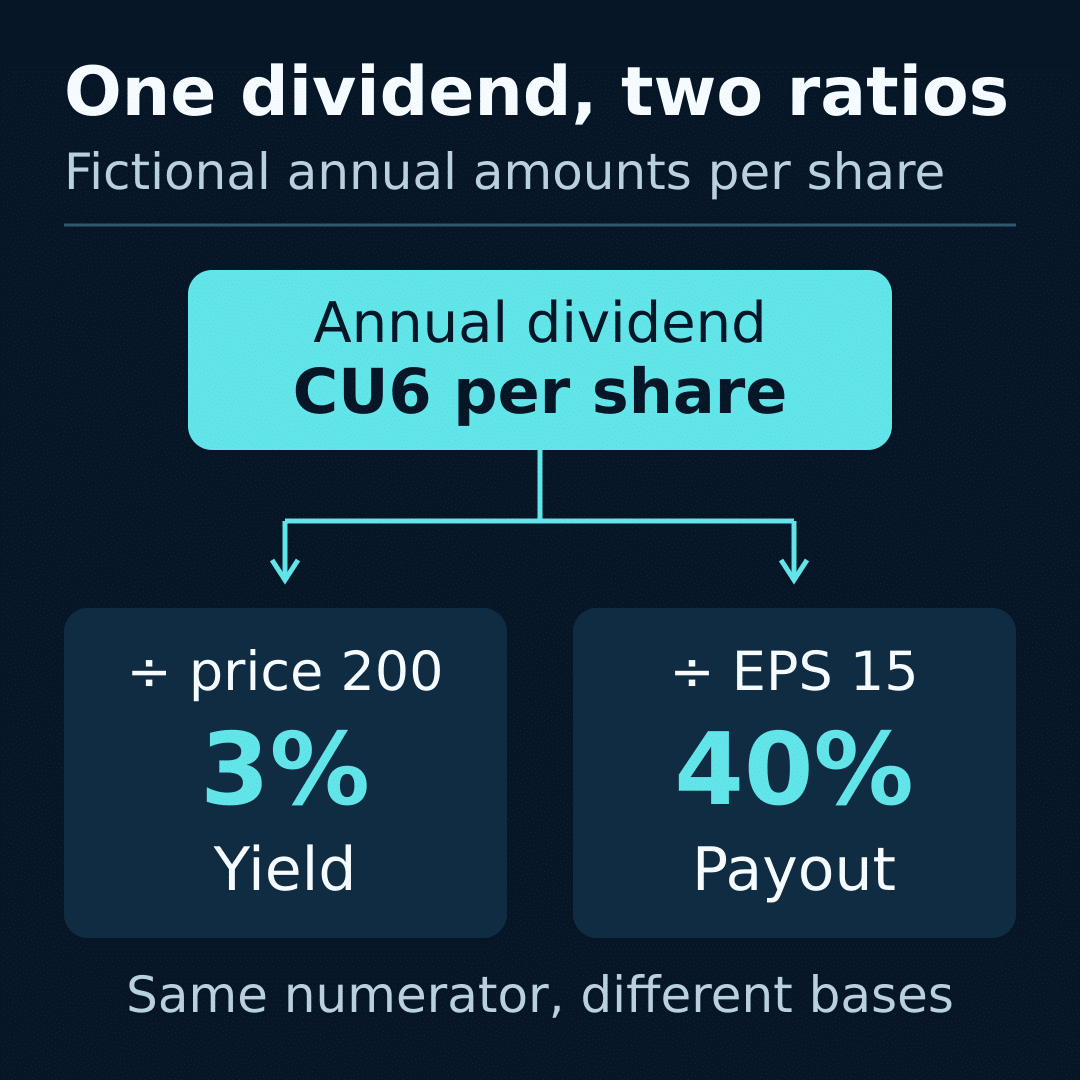
State A: annual dividend per ordinary share is CU6, annual earnings per share are CU15, and the share-price reference is CU200. CU means fictional currency units. Assume a consistent ordinary-share basis, no share-count changes, no preferred claims and no special distributions.
The yield is CU6 ÷ CU200 × 100 = 3%. The payout ratio is CU6 ÷ CU15 × 100 = 40%. One calculation uses the market-price reference, while the other uses the year’s earnings.
The two percentages should not be added. “3% plus 40%” would combine numbers with different bases and has no defined meaning in this example. Similarly, 40% does not describe a return on the CU200 share price.
A reverse check helps catch a misplaced denominator. Three per cent of CU200 is CU6; 40% of CU15 is also CU6. Both routes recover the dividend numerator. If a worksheet fails this check, inspect its inputs before interpreting the result.
Change the price while holding dividends and earnings fixed
State B: keep the annual dividend at CU6 and earnings per share at CU15, but use a CU150 share-price reference. Yield becomes CU6 ÷ CU150 × 100 = 4%. Payout remains CU6 ÷ CU15 × 100 = 40%.
The yield increased by one percentage point solely because the price denominator fell. The annual dividend amount did not change. Describing this as a dividend increase would turn a correct ratio calculation into an incorrect explanation.
This example does not explain why the price changed. A researcher would need separate evidence for that. Preserve the observed or assumed price movement, the unchanged dividend and the unresolved cause as distinct pieces of information.
Change earnings while holding price and dividends fixed
State C: begin from State B and reduce annual earnings per share from CU15 to CU10. Keep the dividend at CU6 and the price at CU150. Yield stays at 4%, while payout rises to CU6 ÷ CU10 × 100 = 60%.
The CU6 distribution now represents a larger share of the stated earnings. The payout ratio rose by 20 percentage points without any increase in the dividend. A headline saying “payout rises” needs to specify whether it means the cash amount or this earnings-based percentage.
Compare dividend yield vs payout ratio across the three states: A is 3% yield and 40% payout; B is 4% and 40%; C is 4% and 60%. Each transition changes one denominator. This controlled approach makes a useful spreadsheet test because a formula referring to the wrong input will change when it should remain fixed.
Check the period and the dividend definition
When comparing dividend yield vs payout ratio, record what the dividend numerator contains. A trailing calculation totals a past period; an indicated annual figure may extrapolate the latest regular payment. For example, multiplying a fictional quarterly CU1.50 by four produces CU6, but does not establish that four future payments will occur.
Separate paid, declared and assumed payments in your notes. If a one-time distribution is included, label it. Mixing a historical special payment into a forward-looking regular dividend estimate can produce a percentage that is mathematically tidy but difficult to interpret.
For payout, align the dividend and earnings windows and their shareholder scope. Comparing a single quarter’s CU1.50 distribution with annual CU15 earnings produces 10%, but it does not reproduce the annual 40% example. The arithmetic works; the period description changed.
Zero earnings make division undefined. Negative earnings can produce a negative numerical payout ratio, which is unhelpful as a conventional earnings-coverage signal. Show the underlying dividend and loss rather than presenting the negative percentage as a favourable low payout. Keep missing inputs distinct from zero using the missing-data checklist.
Use the percentages to guide further report reading
CFA Institute’s 2026 dividend-analysis reading treats dividend policy, coverage, financing and payment history as connected questions. A yield or payout ratio alone cannot establish whether a distribution can continue.
Return to the fictional CU6 dividend and ask what the ratios leave out. They do not identify the source of cash, future earnings, borrowing needs or other claims on resources. Those questions require the company’s statements, notes and policy disclosures, rather than a universal “good” percentage.
Make a compact record in your market research journal: share class, dividend amount and period, price and timestamp, earnings basis, formula, result and source. Finish with the specific explanation supported by the inputs: “Yield rose because the price denominator fell,” or “Payout rose because the earnings denominator fell.”
Frequently asked questions
Can dividend yield rise without a dividend increase?
Yes. States A and B keep the dividend at CU6 while the price falls from CU200 to CU150. Yield moves from 3% to 4%. The explanation lies entirely in the price denominator.
Can the payout ratio rise while cash dividends stay flat?
Yes. In States B and C, the dividend remains CU6 while earnings per share fall from CU15 to CU10. The payout ratio increases from 40% to 60%, although the distribution per share is unchanged.
Does a 40% payout mean a shareholder earns a 40% return?
No. In the baseline example, 40% means CU6 divided by CU15 of earnings. It is unrelated to a 40% return on the CU200 share-price reference. Keep the denominator attached to every percentage.
Is a quoted dividend percentage necessarily dividend yield?
Check the stated base. A fictional notice specifying 60% of CU10 face value describes CU6 per share. If the market price is CU200, the resulting yield is 3%. The quoted face-value percentage and market-price yield answer different questions.
Why might two websites show different dividend yields?
Compare the price timestamp, dividend window, treatment of special payments and currency. One site may annualise the latest payment while another totals past payments. Reconstruct each calculation before concluding that either percentage is wrong.
What does a payout ratio above 100% establish?
With matching positive earnings and dividend definitions, distributions exceed those earnings for the chosen period. The ratio alone does not identify the funding source, prove a legal breach or establish what the next dividend will be.
How should payout be shown during a loss?
Display the dividend and negative earnings explicitly and mark the usual coverage interpretation as not meaningful. A negative numerical result does not demonstrate that a distribution is comfortably covered. If earnings are zero, the division is undefined.
Can I compare quarterly dividends with annual EPS?
Only with an explicit, consistent transformation or a clearly labelled different question. CU1.50 divided by annual CU15 gives 10%; annual CU6 divided by CU15 gives 40%. Do not present those as interchangeable annual payout ratios.
Does a low payout ratio guarantee a sustainable dividend?
No. The percentage describes a relationship to the selected earnings figure. Cash generation, financing obligations, policy decisions and future conditions still matter. Avoid turning a historical ratio into a promise of later payments.
Is dividend yield the same as total return?
No. Yield does not capture the share-price result or all other cash flows and costs across a holding period. The CU6 numerator in this example supports a dividend comparison, not a complete statement of what a shareholder earned.
Sources checked 13 October 2026. Educational content only. All numerical examples are fictional and are not current market data or investment recommendations.