

CrowdSent Blog Team · Market research education
A crypto fear and greed index compresses selected observations into a sentiment-labelled score. Before using one in a research note, identify who produces it, which assets and inputs it covers, and how it handles unavailable information. The familiar name does not guarantee that two providers are measuring the same thing.
This guide explains six methodology checks. It contains no live index reading and does not interpret any score as a price forecast. The practical outcome is a short description of what an identified crypto sentiment index can support, what you cannot reproduce, and whether it matches the question you are investigating.
For an English-language reader in India or Pakistan, a globally displayed gauge can be useful background, but its audience, language coverage and market selection still need checking. A website being accessible from your location does not establish that its sample represents local participants or local-language discussion.
1. Name the crypto fear and greed index provider
Begin with an attribution line: publisher, index name, methodology link and date checked. Include the source of any later score separately. A social post may show one publisher’s graphic while its caption discusses another publisher’s method. Following the image or citation to the original page is the quickest way to catch that mismatch.
Alternative.me’s methodology page describes a daily 0–100 gauge and identifies the current index in its data-source section as Bitcoin-only. It lists volatility at 25%, momentum/volume at 25%, social media at 15%, surveys at 15%, dominance at 10% and trends at 10%. The survey component is marked paused. These are the published descriptions checked for this article, not a reconstruction of its current calculation.
Identify the series by its provider, asset universe and method version. A shared “fear and greed” title or colour scheme does not make two series interchangeable.
If your starting point is a headline, use the market-news verification process to preserve the original publisher, publication time and linked source. The headline’s interpretation belongs in a separate field from the index’s own documented definition.
2. Match the index coverage to your research question
Define the question before choosing the gauge. You might be investigating how one published index changed over a month, whether two index methodologies differ, or how a discussion about a specific trading pair evolved. Each question calls for different evidence. A broad composite alone cannot answer all three.
Coverage has several dimensions. The asset universe describes which instruments contribute. The venue universe describes where any market observations come from. Language and platform coverage describe the discussions or searches represented. The observation period defines the time slice. Record an explicit “not disclosed” where the documentation does not resolve one of these dimensions.
CoinMarketCap’s own index explanation describes a different set of components: momentum among leading cryptocurrencies, Bitcoin and Ethereum implied volatility and options information, a market-composition measure, and proprietary engagement data. This establishes a methodological distinction from the first example. It does not establish which index is better or make either a direct measure of every market participant.
Build a simple coverage statement in ordinary language: “This series combines the provider’s selected observations; my research question concerns a narrower asset and window.” Then decide whether the series provides background, a direct measurement or neither. The choice should follow the documented scope.
Hypothetical coverage mismatch: a researcher studies fifty English-language posts about fictional Token R during one hour. A separate daily composite uses a broader market sample. The post sample becomes more optimistic while the composite falls. Both observations can coexist because the objects, times and inputs differ. Calling either result wrong would require further evidence.
Use the guide to sentiment-score meaning when documenting a score’s scale and scope. A pair-specific score, a survey percentage and a blended index can all use numbers near fifty while answering different questions.
3. Separate input observations from interpretation rules
A composite has at least three layers: incoming observations, transformations and the final labelled result. Ask what exists at each layer. A price observation is different from a volatility calculation; an interaction count is different from the interpretation assigned to that interaction; a final category is different from the numerical score beneath it.
For each documented component, make a short evidence card:
- Observation: what was collected, with the source and time window.
- Transformation: whether it was averaged, standardised, compared with a baseline or otherwise adjusted.
- Interpretation: why a change is mapped toward one end of the scale.
- Contribution: the weighting or combination rule, if disclosed.
- Reproducibility: which raw inputs and exact rules you can actually inspect.
This separation prevents descriptive language from silently becoming a fact about intentions. A search query can reflect curiosity, concern, an academic assignment or a response to news. Assigning it a sentiment direction is a modelling decision. Record the decision without pretending you know every searcher’s motive.
Google’s explanation of Trends data says the service uses sampled searches and normalises interest for the selected geography and period. Its scale is relative, and low-volume terms can display zero. Google also distinguishes search interest from polling. Those qualifications matter whenever a researcher encounters search-based evidence inside or alongside a sentiment index.
Similarly, more posts do not automatically imply more unique people. A discussion may include repetition, quotations or links to one widely shared story. When examining that separate evidence, the community-discussion evaluation guide helps keep source diversity and repeated claims visible. Do not attribute a cleaning procedure to an index provider unless its documentation states it.
Look for dependence between inputs. If two components respond to the same underlying movement, their coexistence is not necessarily two independent confirmations. You need the transformations and relationships to evaluate that issue. A list of component names alone cannot establish independence.
4. Ask what happens when an input is missing
A displayed component list is not automatically a complete operational specification. When a feed is delayed, paused or unavailable, possible treatments include omitting it, adjusting the remaining weights, retaining an older observation or withholding the composite. These choices can produce different results. Unless the provider documents the choice, record it as unresolved.
The paused survey label in the first provider example is precisely the kind of qualification worth preserving. It does not, by itself, establish how the remaining components are combined today. Avoid quietly redistributing that weight in your own description and presenting the result as the publisher’s formula.
Consider an entirely fictional index with three components. A has a weight of 40% and a score of 40. B has a weight of 40% and a score of 60. C has a weight of 20%, but its score is unavailable. These invented weights and inputs are unrelated to either real provider’s calculations.
- A contributes 0.40 × 40 = 16 points.
- B contributes 0.40 × 60 = 24 points.
- The known weighted contribution is 40 points, with 20% of the intended weight unresolved.
- Assigning C a zero produces a displayed total of 40 under that assumption.
- Renormalising the available components produces 40 ÷ 0.80 = 50 under a different assumption.
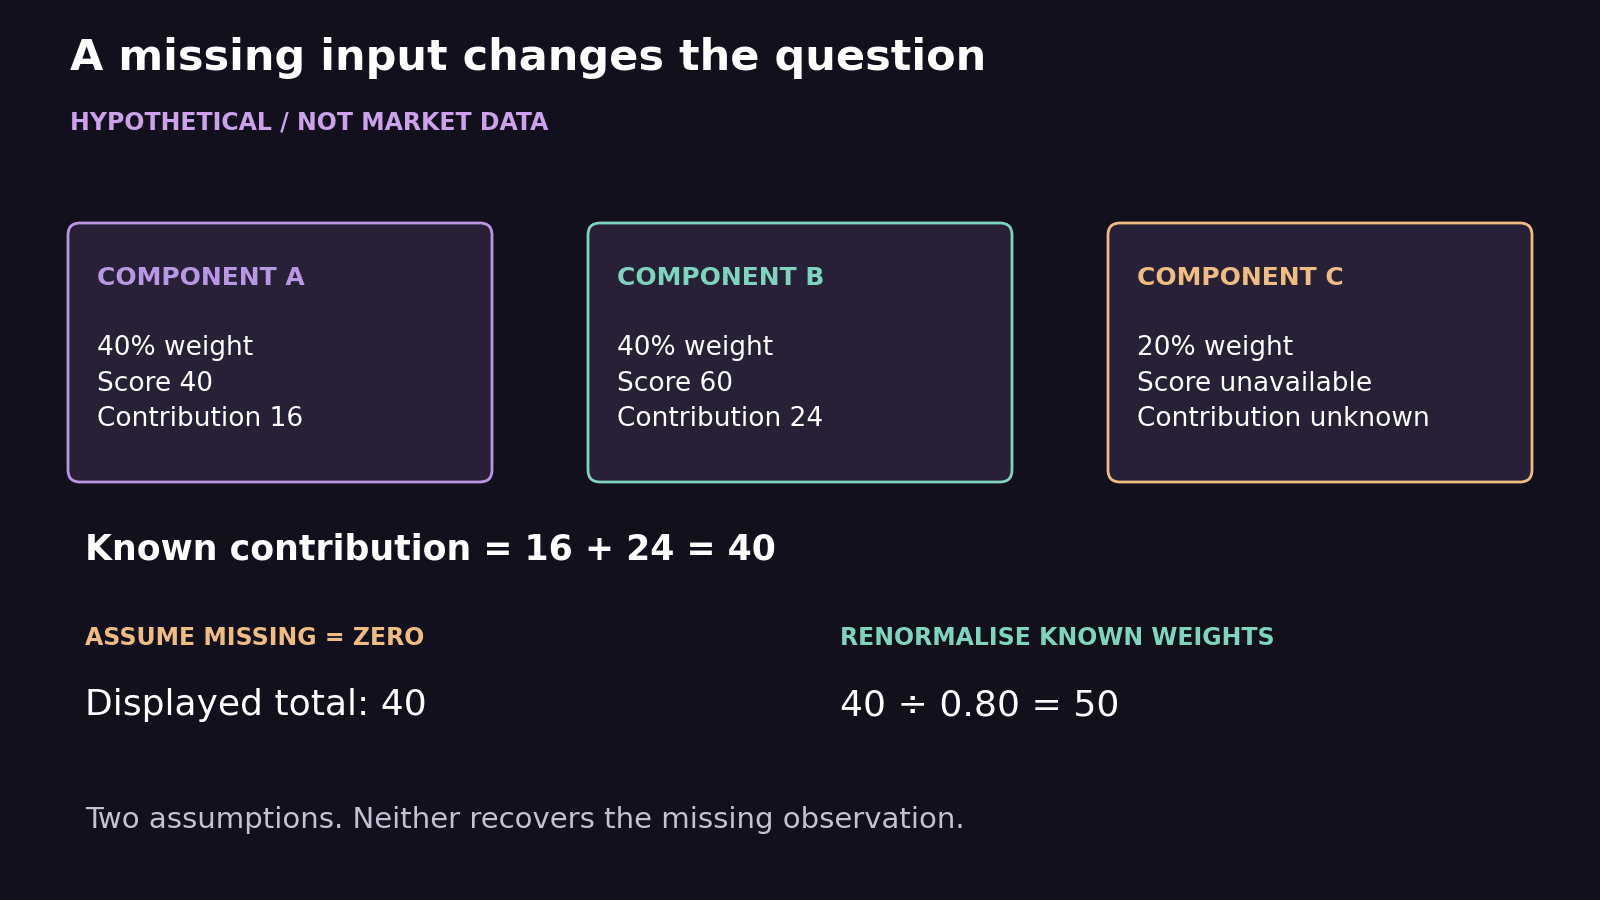
Neither answer is a reconstruction of the missing observation. They are two different operations. If the fictional specification simply says “weighted average” without a missing-input rule, the reproducible conclusion is that the final score cannot yet be determined from the available information.
A useful question for any methodology is: “Can I tell the difference between a genuine low observation and an unavailable component?” The distinction matters even if the final graphic looks complete. Apparent numerical precision cannot replace a disclosed data-handling rule.
Preserve any version or revision note you find. If the construction changes, do not automatically describe a movement across that boundary as a change in sentiment alone. Part of the difference may arise from the changed measurement process. Without a parallel calculation, you may be unable to separate those effects.
5. Check the calendar and preserve comparable history
Save three timestamps where available: the observation period, publication time and your collection time. They answer different questions. An index dated Monday may summarise inputs collected earlier; a screenshot taken Tuesday may still display Monday’s value. A page reload time does not establish a new observation.
State the time zone when matching an index to another record. A UTC date boundary occurs at a different local clock time in India and Pakistan. If you compare daily series, determine whether “day” means the same interval in each source before interpreting a disagreement. Keep ambiguous date formats out of your working notes.
Use the same provider and documented method for a within-series comparison wherever possible. If you switch providers, mark the boundary clearly. Joining the first half of one provider’s history to the second half of another can create a graph whose apparent trend partly reflects the splice.
Hypothetical history problem: an archive gives fictional Composite A a value of 48 on one study date. A later download gives 51 for the same date. Before explaining the difference, compare version labels, revision information and whether the dates refer to identical windows. Preserve both downloads and their collection times. Do not silently overwrite the first record.
A score difference is usually best reported first as an index-point difference. Moving from a fictional 40 to 50 is ten points. Describing it as “25% more optimism” assigns a psychological interpretation that the arithmetic does not establish. A bounded scale is not automatically a ratio measure of human feeling.
Investigate category changes with the same care. If labels switch around a threshold, a small numerical change can produce a more dramatic headline. Use the provider’s documented classifications and retain the numerical values when permitted. Do not invent universal boundaries that you expect every index to follow.
6. Write a method-aware summary with a clear limit
Finish with a compact methodology note, even when you have no reason to quote a current number. It should tell another reader exactly what kind of evidence the index contributes to your work.
- Identify the publisher and the specific series.
- State the documented asset and observation scope.
- List the input categories at a useful level of detail.
- Separate disclosed rules from unresolved transformations or gaps.
- Record time conventions, method version and any revision issue.
- Explain the narrow claim your use of the series supports.
A good hypothetical conclusion is: “The two gauges describe different selected evidence, so their numerical levels are not directly interchangeable. The first is useful background for our question, while the missing-input treatment remains unverified.” That conclusion communicates useful work without manufacturing a ranking of providers.
If you later investigate whether a particular index historically related to a specified outcome, treat that as a separate research project. Define the outcome, horizon, sample and comparison method in advance. The presence of a sentiment label is insufficient evidence of predictive usefulness.
Frequently asked questions about the crypto fear and greed index
Is there one official crypto fear and greed index?
There are separately produced indices with their own definitions. Identify the publisher whenever you mention one. A similar name or scale does not make their histories interchangeable. The useful first question is which documented series the article, screenshot or research note actually refers to.
Does a score of seventy mean seventy percent of people are optimistic?
That interpretation would require a population survey with that defined response percentage. A composite score combines chosen inputs according to a construction rule. Read its definition before assigning a population meaning. The number on the dial alone cannot tell you how many people hold an opinion.
Can a Bitcoin-focused gauge describe sentiment about every token?
It may provide background, but broader coverage needs evidence. A specific token can have different news, discussion and market conditions. State the difference between the gauge’s scope and your question. Avoid relabelling a broad or differently focused observation as a direct measurement of the asset you are studying.
Should I redistribute a paused component’s weight myself?
You can examine a clearly labelled hypothetical sensitivity calculation, as this article does. You cannot call that calculation the provider’s current method without documentation. Renormalising, carrying forward and withholding a score make different assumptions. Keep any researcher-created variant separate from the published series.
Why can two indices move in opposite directions?
They may use different inputs, asset universes, transformations or windows. Check those differences before declaring a contradiction. Agreement and disagreement both require comparable definitions to be informative. A single day’s opposite movement is a starting observation for a methodology comparison, not proof that one publisher is unreliable.
Does high social engagement necessarily indicate positive sentiment?
Engagement describes activity unless a documented method assigns more meaning. A widely discussed failure can attract substantial attention. Inspect what is counted and how content is interpreted. When those details are unavailable, avoid translating an interaction total into a claim about approval or optimism.
Does viewing an index from India or Pakistan make it a local sentiment measure?
Your location and the page’s language do not establish the geographic coverage of its inputs. Check the provider’s disclosure of the markets, sources and audiences represented. If that coverage is unavailable, leave it unverified rather than describing a globally displayed gauge as a measure of Indian or Pakistani sentiment.
Does an extreme label establish an imminent reversal?
A label describes a position within the provider’s classification scheme. Any claim about a later reversal adds an outcome and time horizon that need separate evidence. Preserve the distinction between describing an index observation and predicting a future market event.
What if I cannot reproduce the complete index calculation?
Explain which inputs or transformations are unavailable, and limit your claim accordingly. You may still describe the publisher’s stated scope and report an attributed series. Full reproducibility is a separate property. Avoid implying an independent audit when you have only inspected a public methodology summary.
What should I save when quoting a historical value?
Retain the provider, series identifier, observation date, collection time, methodology link and any version information. Keep the value’s original classification alongside it. If later downloads differ, preserve the revision trail so someone can understand what evidence was available when you wrote the note.
Source documentation checked 7 October 2026. Educational research guidance. Hypothetical examples are invented and are not current market observations. This article does not provide investment recommendations.