

Unemployment rate vs labor force participation is a comparison between two different denominators. The US unemployment rate asks what share of the labor force is unemployed. The participation rate asks what share of the eligible population belongs to that labor force. Reading them together helps explain why a falling unemployment rate does not always mean more people found work.
A jobs headline often combines payroll growth, unemployment and participation in one sentence. Those figures answer different questions. Before deciding whether a report describes improvement or deterioration, separate the measures and reconstruct the arithmetic.
This guide uses US Bureau of Labor Statistics definitions because US releases are common benchmarks in global economic coverage. The worked examples are invented for learning. Readers in India and Pakistan should check their own statistical agencies’ definitions before applying the same labels to domestic releases.
1. Start with the unemployment rate denominator
For US household-survey statistics, the base population is the civilian noninstitutional population age 16 and older. It excludes active-duty military personnel and people in institutions such as prisons and residential care facilities. There is no upper age cutoff.
The labor force contains employed people plus unemployed people. Someone can therefore belong to the labor force without having a job. Someone outside the labor force belongs to neither of those two categories under the survey’s rules.
- Unemployment rate = unemployed people ÷ labor force × 100
- Labor force participation rate = labor force ÷ eligible population × 100
- Employment-population ratio = employed people ÷ eligible population × 100
These are the central relationships in the BLS labor-force definitions. Keep the labels attached when writing a percentage: “5% unemployed” is incomplete unless readers know which population supplies the denominator.
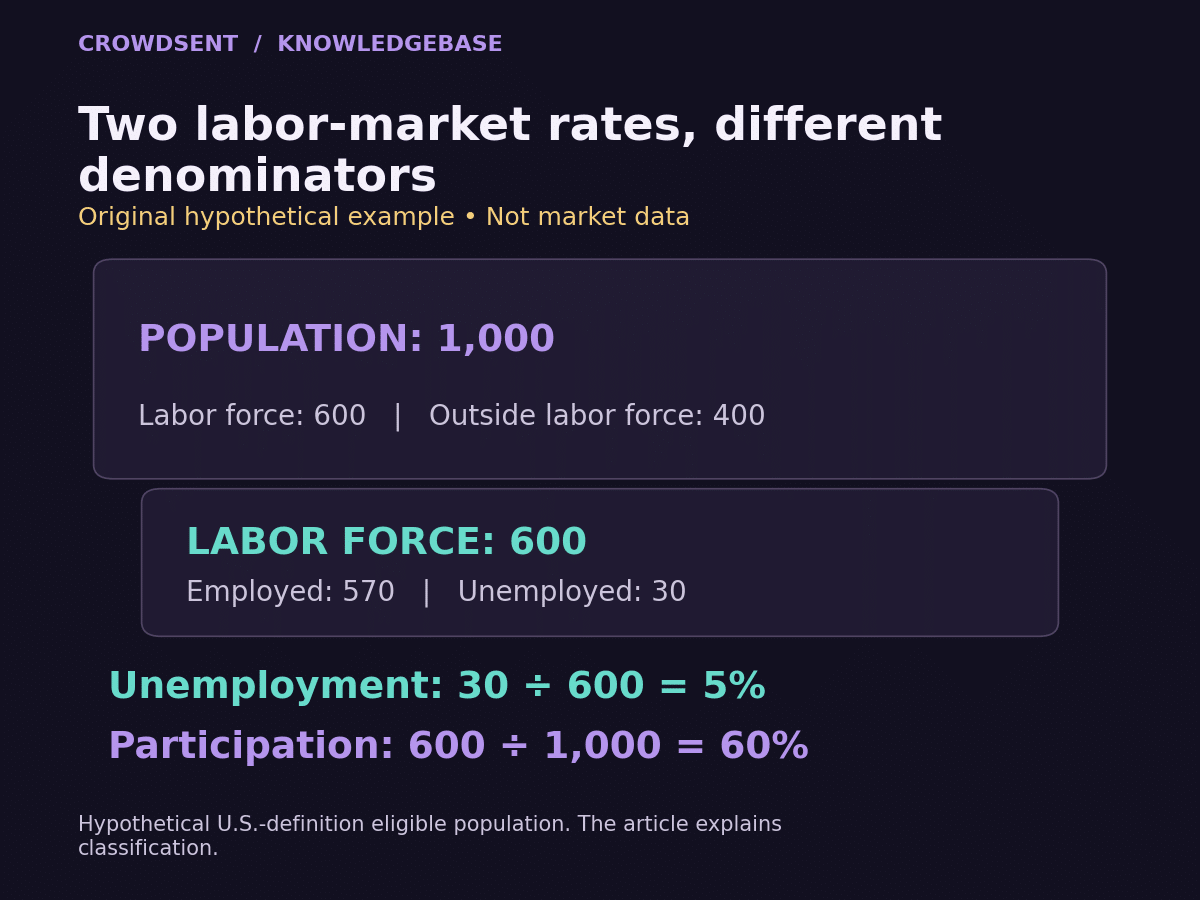
Imagine three boxes. The largest holds the eligible population. Inside it, one box holds everyone in the labor force. That smaller box is split into employed and unemployed people. Participation measures the size of the middle box relative to the largest; unemployment measures one part of the middle box relative to the whole middle box.
2. Follow the same 1,000 people through three scenarios
Start with a hypothetical population of 1,000 eligible people. Of these, 570 are employed, 30 are unemployed and 400 are outside the labor force. For this exercise, assume the population total stays fixed and no other changes occur.
The labor force is 570 + 30 = 600. The unemployment rate is 30 ÷ 600 = 5%. The participation rate is 600 ÷ 1,000 = 60%. The employment-population ratio is 570 ÷ 1,000 = 57%.
Now consider three alternative next periods. Each begins from that same starting point; they are not consecutive stages.
Scenario A: ten unemployed people find work
Employment increases to 580 and unemployment falls to 20. The labor force remains 600 because these people were already included while searching.
Unemployment becomes 20 ÷ 600, or about 3.33%. Participation remains 60%. The employment-population ratio increases to 58%. In this simplified scenario, the lower unemployment rate accompanies an increase in employment.
Scenario B: ten unemployed people leave the labor force
Employment stays at 570. Unemployment falls to 20 because ten people no longer meet the unemployment criteria and move outside the labor force. The labor force falls to 590.
Unemployment becomes 20 ÷ 590, or about 3.39%. Participation falls to 59%. The employment-population ratio remains 57%. The unemployment rate again falls substantially, but nobody in this example gained a job.
The arithmetic identifies a different mechanism. It does not tell us why those ten people stopped participating. That requires further evidence rather than an assumption about their motivation.
Scenario C: ten people enter the labor force to search
Employment stays at 570, but unemployment rises to 40 as ten previously nonparticipating people become active job seekers who meet the unemployment criteria. The labor force grows to 610.
Unemployment becomes 40 ÷ 610, or about 6.56%. Participation rises to 61%. The employment-population ratio remains 57%. Here unemployment rises without any employed person losing a job.
These examples explain why one rate cannot carry the whole story. In actual data, hiring, job losses, entry, exit and population changes can all occur together. A published monthly change is the net result of many movements, not a description of one simple transition.
3. Check who is counted as unemployed
In ordinary conversation, “unemployed” may mean anyone without a paid job. The statistical category is narrower. Generally, a person must have no employment, be available for work, and have made an active job-search effort in the preceding four weeks. People on temporary layoff expecting recall can qualify without an active search.
The BLS explanation of unemployment measurement also distinguishes paid or profit-making work, including part-time work, from the absence of a job. Receiving unemployment benefits is not the test used to classify someone in the survey.
Suppose a hypothetical reader encounters a story about three neighbors. One sent applications and is available to start. Another has chosen full-time study and is not searching. A third works several paid hours each week but would prefer more. Calling all three “unemployed” would erase important differences in what the statistic measures.
A useful reading habit is to ask which survey question supports the classification. A description such as “wants a better job” is insufficient on its own. So is “has no salary this week,” since some employed people can be temporarily absent from an existing job.
People outside the labor force are also a varied group. Treating them all as discouraged job seekers gives the category a meaning it does not have. Likewise, treating every participation increase as an unqualified improvement goes beyond the arithmetic. The surrounding circumstances matter.
4. Keep household rates separate from payroll jobs
The unemployment and participation rates come from the household survey. Nonfarm payroll employment comes from a separate establishment survey. The BLS comparison of the household and payroll surveys explains that the household measure counts people, while the payroll measure counts jobs and uses different coverage and estimation methods.
A person holding two covered payroll jobs can contribute two jobs to the payroll count while remaining one employed person in the household count. Household employment also includes categories outside the nonfarm payroll scope, such as self-employment.
Consider a hypothetical person who keeps a main job and adds a second job. A payroll count may increase even though the number of employed people has not changed. Now imagine a payroll employee becomes self-employed. The two surveys can record that transition differently without either being a simple mistake.
This distinction is especially useful when a report pairs a payroll gain with a higher unemployment rate. Do not subtract one headline from the other. Check the household counts, participation and survey definitions before trying to reconcile the direction of change.
This article focuses on labor-force denominators. A payroll report adds another view of hiring, industry activity and hours, but it cannot by itself provide the household survey’s denominator.
5. Match the time period and allow for uncertainty
A release date tells you when the figures became public. It is different from the reference period that the survey describes. The household reference week usually includes the month’s 12th day, with specified exceptions; the payroll survey uses the pay period including the 12th.
Also check whether each series is seasonally adjusted. Comparing an adjusted national rate with an unadjusted subgroup rate can introduce seasonal patterns into a comparison that appears otherwise straightforward.
The Employment Situation technical notes explain that these are sample-based estimates with statistical uncertainty. Small monthly movements should be read alongside longer runs of data and the release’s discussion of significant changes.
For a practical note-taking example, imagine one screenshot says “4.2%” and another says “4.3%.” Before describing a change, confirm the country, series, month, adjustment, population and publication version. If those match, the displayed difference is 0.1 percentage point. Whether it represents a meaningful change is a separate question.
Age composition also affects an aggregate participation rate. A comparison across periods or countries is easier to interpret when the population groups are aligned. A prime-age series and an all-adult series should keep their different labels even if their chart lines look similar.
The guide to verifying market news helps establish the source and timing before a headline becomes part of a larger argument.
6. Write a balanced interpretation in four lines
A research note can be short without losing the denominator. Try the following structure using the hypothetical starting point and Scenario B above:
- Observation: unemployment fell from 5% to about 3.39%
- Denominator: the labor force fell from 600 to 590 while the population stayed at 1,000
- Cross-check: participation fell from 60% to 59%; employment stayed at 570
- Boundary: the example shows labor-force exit, but it gives no evidence about people’s reasons
That final boundary prevents a calculation from turning into an unsupported social or market narrative. In a real release, add source links and a note on revisions or uncertainty rather than filling the gap with confidence.
The market research journal template can hold these fields together. Keep your economic observation separate from any discussion of how people interpret it. Our introduction to market sentiment explains that second layer of analysis.
Frequently asked questions
Is labor force participation the same as employment?
No. Participation includes employed people and unemployed people who meet the survey criteria. In the hypothetical starting point, 600 people participate but only 570 are employed. Keeping those two counts separate makes the difference visible immediately.
Can unemployment fall without employment rising?
Yes. Scenario B shows how a smaller unemployed count and a smaller labor force can lower the rate while employment stays fixed. The unemployment rate alone cannot distinguish that case from unemployed people finding work.
Can unemployment rise without job losses?
Yes. In Scenario C, additional people begin qualifying as unemployed while the employed count remains unchanged. Entry into the labor force changes both the unemployed numerator and the labor-force denominator.
Does a 5% unemployment rate mean 95% of adults work?
No. The 5% applies to the labor force. In our example, 95% of the labor force is employed, but only 57% of the eligible population is employed. The percentages answer different questions.
Does claiming unemployment benefits determine survey status?
No. Benefit receipt and survey classification are different concepts. For a release interpretation, use the survey definitions instead of substituting benefit rolls, which have their own eligibility rules and administrative purposes.
Are part-time workers counted as employed?
They can be. Employment classification does not require a full-time job. If your question concerns people who want additional hours, inspect the relevant hours and underutilization measures rather than expecting the headline unemployment rate to answer it.
What does the employment-population ratio add?
It puts employed people over the eligible population, so it provides another check on the two headline rates. In all three examples, this third measure helps reveal whether the employed share actually changed.
Is the highest participation rate always the best outcome?
A rate cannot answer that value judgment by itself. Population structure and people’s circumstances matter. A useful comparison identifies who is participating and why before assigning a single positive or negative label.
Can I compare US figures directly with Indian or Pakistani rates?
Only after checking definitions, age coverage, reference periods and survey methods. Similar names do not establish identical measurements. Use each official release’s documentation and clearly label any remaining differences in your comparison.
What should I record when saving a labor-market headline?
Save the source, reference month, publication date, adjustment basis, unemployment rate, participation rate and relevant population counts. Add a separate sentence for interpretation. This makes later corrections possible without rewriting what the source originally reported.
The most useful habit is simple: read the numerator, read the denominator, then check employment.