

ROE vs ROA compares profit with two different resource bases. Return on equity relates earnings to shareholders’ book equity. Return on assets relates earnings to the asset base. Reading both can help explain whether a striking equity return reflects stronger profitability, a smaller equity denominator, or a combination.
This article uses annual net income divided by average balances and assumes one ordinary share class with no noncontrolling interest. More complicated ownership structures require matching the earnings attributable to a particular group with that group’s equity.
ROE vs ROA: match each numerator with its denominator
Under the conventions used here, ROA equals net income divided by average total assets, and ROE equals net income divided by average shareholders’ equity. The CFA Institute financial ratio list distinguishes these measures from operating ROA, which uses operating income.
That distinction is important because interest expense affects net income. Net-income ROA therefore still reflects financing costs. It should not be presented as a financing-neutral measure simply because assets appear in its denominator.
The SEC’s financial-statement guide explains the balance-sheet relationship between assets, liabilities and shareholders’ equity. Book equity is the accounting residual. It is different from the stock-market value investors collectively assign to the company’s shares.
Work through an average-balance example
Assume a company earns $60 million during a year. Assets begin at $900 million and end at $1,100 million. A simple beginning-and-ending average gives $1,000 million. Equity begins at $360 million and ends at $440 million, giving average equity of $400 million.
ROA is $60 million divided by $1,000 million, or 6%. ROE is $60 million divided by $400 million, or 15%. Both use the same income amount, yet answer different questions about its scale relative to the accounting resources.
The corresponding average-assets-to-average-equity multiple is 2.5. Multiplying 6% by 2.5 gives 15%. The ROE vs ROA identity works because the periods, numerator and balance definitions match. Mixing common-shareholder ROE with a different total-income ROA can break that simple comparison.
See how financing changes the result
Now compare two separate hypothetical companies with average assets of $1,000 million each and operating profit before interest and tax of $120 million. Assume all liabilities are interest-bearing debt, borrowing costs 4% annually, balances are stable for the calculation, and taxes equal 25% of positive pretax income.
Company A has $500 million debt and $500 million equity. Interest is $20 million, pretax income is $100 million, and tax is $25 million. Net income of $75 million produces 7.50% ROA and 15% ROE.
Company B has $750 million debt and $250 million equity. Interest is $30 million, pretax income is $90 million, and tax is $22.5 million. Net income of $67.5 million produces 6.75% ROA and 27% ROE.
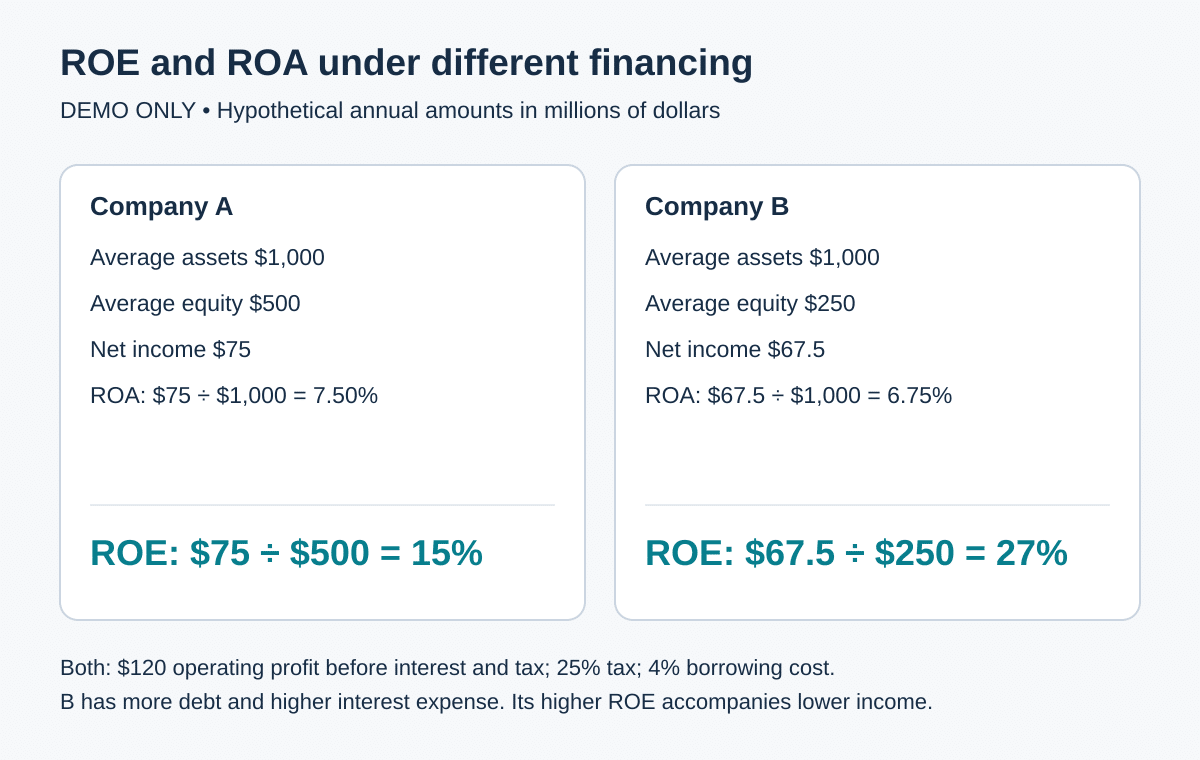
B’s ROE is higher even though its net income and ROA are lower. The smaller equity base more than offsets the lower income in that ratio. This numerical result does not recommend additional borrowing; it illustrates why the financing structure belongs beside the headline percentage.
Check whether the average represents the year
A simple two-point average can be misleading after a large acquisition, share issuance or repurchase. If assets are acquired on the final day of the year, averaging opening and closing balances effectively gives that closing change substantial weight despite almost no time to contribute income.
More frequent balances or a time-weighted calculation can better represent a large midyear change when reliable data is available. State the method. A calculation using quarterly average balances is not automatically comparable with one using only a year-end denominator.
Keep annual and quarterly earnings separate. Multiplying a quarter’s income by four is an annualization assumption, not an observed full-year result. Seasonality or exceptional items can make that extrapolation particularly unhelpful.
Investigate unusually high or unstable returns
Repurchases can reduce book equity and raise ROE mechanically, while losses or write-downs can shrink future denominators. A company with very little equity can produce an extreme percentage from a modest income amount. Negative equity makes ordinary ranking especially problematic.
Asset accounting matters too. Older depreciated equipment, acquisitions and recognized intangible assets can change the recorded asset base. Two firms performing similar economic activities may therefore report different ROA partly because of accounting history.
For ROE vs ROA comparisons, choose firms with similar business models and inspect several periods. Keep the underlying income, average assets, average equity and financing costs visible. These numbers help explain the return rather than asking one percentage to summarize profitability, risk and market value at once.
ROE vs ROA: common questions
1. Is ROE the same as a shareholder’s investment return?
No. ROE uses accounting earnings and book equity. A shareholder’s realized or market return depends on purchase price, dividends, sale proceeds and timing.
2. Why use average assets and equity?
Income accumulates over a period, while balance-sheet amounts are measured at dates. An average better aligns the resource base with that period, subject to the averaging method.
3. Can higher ROE accompany lower profits?
Yes. In the financing example, B earns less than A but divides that income by a much smaller equity base, producing a higher ROE.
4. Does net-income ROA ignore borrowing costs?
No. Interest affects net income. Operating ROA uses a different numerator and must be labeled separately rather than treated as interchangeable.
5. What happens when average equity is zero?
ROE is undefined because the calculation divides by zero. Describe the underlying balances and earnings instead of reporting a conventional percentage.
6. Can a loss and negative equity produce positive ROE?
Mathematically, dividing two negative numbers produces a positive value. That sign does not indicate healthy profitability or make the ratio suitable for ordinary rankings.
7. How should preferred dividends be handled?
For a common-equity return, align earnings available to common shareholders with average common equity. Do not mix that denominator with an unadjusted broader income measure.
8. Does a share repurchase always signal better operations?
No. It can reduce the equity denominator without raising operating earnings. Financing costs and the timing of the repurchase also affect the comparison.
9. Is a two-point average always enough?
No. Major changes during the year may warrant more frequent or time-weighted balances. State the method and acknowledge when available data limits precision.
10. Can ROE and ROA identify a good share price?
Neither includes the share price in the calculation. They provide accounting context and cannot, by themselves, establish valuation or a suitable investment decision.
Educational note: This article explains financial-statement analysis, not investment advice. All company figures are hypothetical. Ratios and cash-flow measures do not predict share prices or guarantee financial outcomes.
Explore CrowdSent membership.
Keep the source date, units, reporting boundary and calculations together in a market research journal so later comparisons can be reproduced.