

By CrowdSent Blog Team
Refinery utilization measures how heavily a defined set of refining units is being used relative to its stated capacity. In the U.S. EIA series, the headline rate concerns atmospheric crude-oil distillation units. It is a ratio of processing activity to capacity, expressed as a percentage.
The percentage is useful, but it does not tell you everything about fuel production. A higher rate can result from more input, less measured capacity, or both. To interpret it, keep the numerator and denominator visible and then examine the products leaving the refining system.
What does refinery utilization actually measure?
The EIA refinery glossary defines the utilization rate as gross input to atmospheric crude-oil distillation units divided by their operable refining capacity. Gross input can include crude oil, unfinished oils and natural-gas plant liquids. It should not automatically be replaced with a separately reported crude-only input series.
Written simply, utilization equals gross input divided by operable capacity, multiplied by 100. Both input and capacity must use compatible units. If one is recorded in thousands of barrels per day and the other in millions, convert them before dividing.
The unit boundary is important. A refinery is a collection of processes, and a rate for crude distillation does not directly measure how intensively every downstream unit is working. Treat the headline as a defined indicator rather than a complete operating diagnosis.
It also differs from refinery yield. Yield concerns the product obtained relative to relevant inputs; utilization concerns activity relative to capacity. A plant can change its processing intensity without maintaining exactly the same mix of gasoline, diesel and other output.
Why the capacity denominator needs its own check
Capacity is not a universal number independent of convention. EIA distinguishes barrels per calendar day from barrels per stream day. Its capacity definitions describe calendar-day capacity under usual operating conditions, with allowances for limitations and downtime. Stream-day capacity describes full operation under optimal conditions without a downtime allowance.
For a comparison, the consequence is straightforward: two reported capacity figures can differ even when they refer to the same physical installation. A utilization percentage built from one denominator should not be compared casually with a percentage built from the other.
Also inspect the reporting period. A weekly input observation divided by an unrelated year-end capacity figure might create a plausible-looking percentage that is not the official measure. Use the denominator supplied for the series, and document any independent calculation as your own.
A useful data record keeps three fields together: gross input, operable capacity and utilization. When a change looks unusual, inspect all three. A percentage chart alone hides whether the system processed more material or merely had less stated capacity available in the comparison.
A lower rate can accompany more processing
Consider a separate hypothetical comparison with an unchanged capacity convention and reporting frequency. In period one, gross input is 16.2 million barrels per day against capacity of 18 million, giving 90% utilization. In period two, added operable capacity takes the denominator to 19.2 million while input rises to 16.8 million. Utilization becomes 87.5%.
The headline rate fell by 2.5 percentage points, yet daily processing increased by 0.6 million barrels, or approximately 3.70%. The capacity denominator grew faster than input. Describing the lower percentage as a decline in processing would therefore reverse what the underlying quantities show.
The arithmetic gap between capacity and input also widens, from 1.8 million to 2.4 million barrels per day. Treat that as a comparison between the reported quantities, rather than guaranteed immediately available output. Operating constraints and the capacity definition still matter. For this observation, record both the higher throughput and the lower utilization rate.
Worked example: a higher rate with unchanged processing
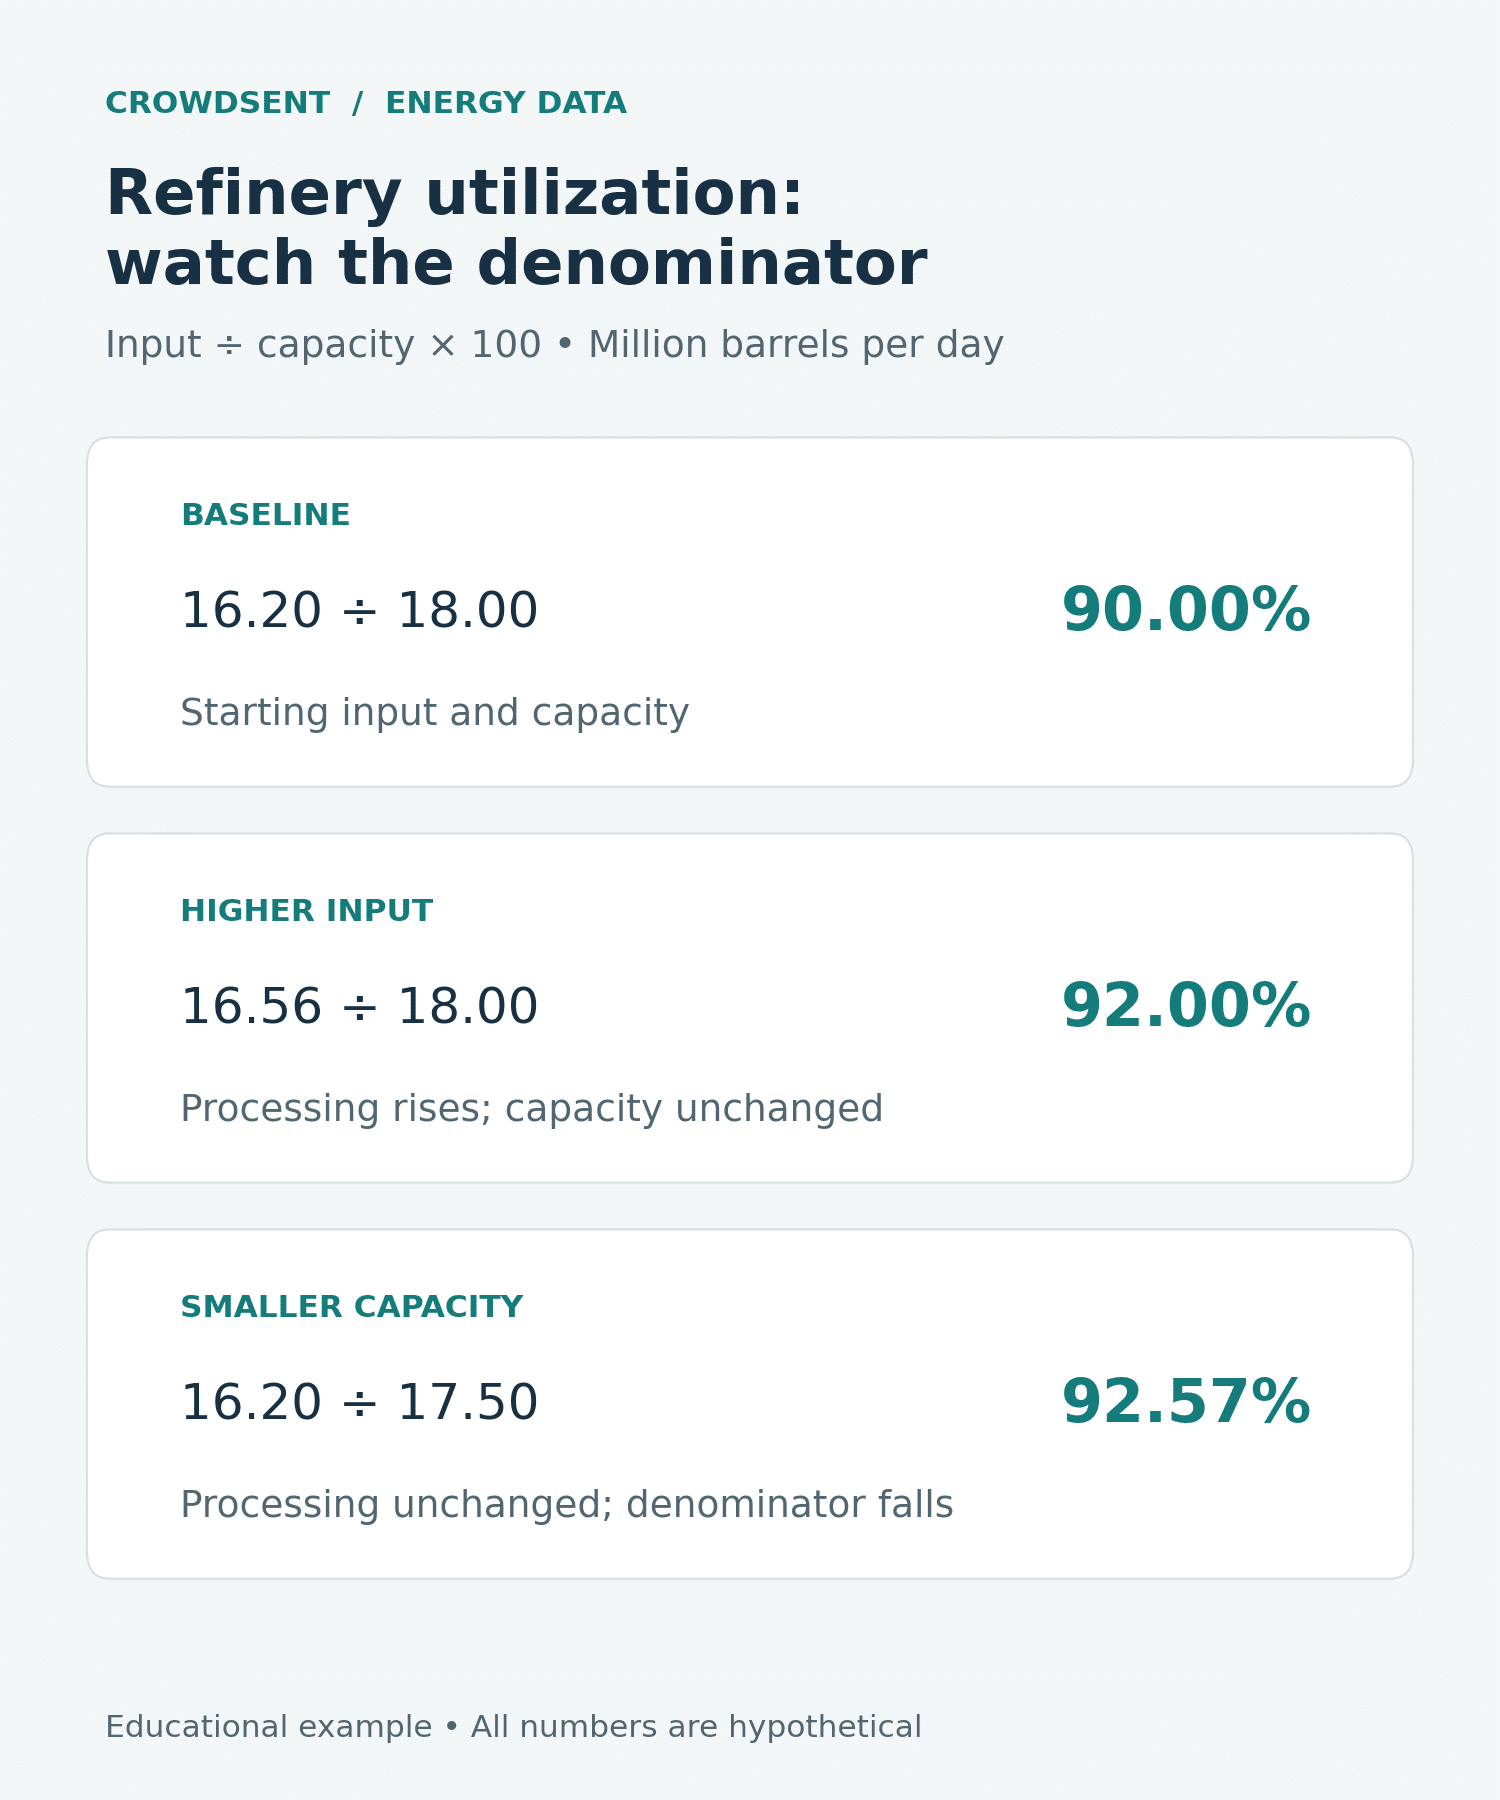
Imagine a hypothetical refining system with gross input of 16.2 million barrels per day and operable capacity of 18 million barrels per day. Its utilization rate is 16.2 divided by 18, multiplied by 100, or 90%.
In the next observation, gross input rises to 16.56 million barrels per day while capacity remains 18 million. Utilization becomes 92%. The rate increased by 2 percentage points, and processing rose by 0.36 million barrels per day. Here the higher rate genuinely accompanies higher throughput.
Now consider a separate scenario. Gross input stays at 16.2 million barrels per day, but the comparable capacity denominator falls to 17.5 million. Utilization becomes approximately 92.57%. The rate rises by about 2.57 percentage points even though the system processes no additional material.
These two scenarios would both produce an upward utilization chart. Their implications for the amount of crude being processed are different. The first adds activity; the second changes the denominator. An explanation that records only the percentage would miss that distinction.
For another perspective, multiply the first scenario’s additional 0.36 million barrels per day by seven days. That is 2.52 million additional barrels of gross input over a seven-day interval, assuming the reported daily figure is the interval’s average. It is not a claim that an extra 2.52 million barrels of gasoline were produced.
Finally, check the wording. Moving from 90% to 92% is a rise of 2 percentage points. The relative increase in the utilization rate is 2 divided by 90, or approximately 2.22%. Both calculations are valid, but they answer different questions and should be labeled accordingly.
Do not average regional utilization rates equally
An aggregate rate is generally built from aggregate input and aggregate capacity. A simple average of regional percentages gives small and large regions equal weight, which can distort the result.
For an invented two-region system, suppose Region A has capacity of 1 million barrels per day and runs at 50%. Region B has capacity of 9 million and runs at 90%. Their inputs are 0.5 million and 8.1 million respectively. Combined input is 8.6 million against capacity of 10 million, giving aggregate utilization of 86%.
The unweighted average of 50% and 90% is only 70%. That number describes the average of two region labels, not the share of the combined capacity being used. When reconstructing a national figure, use the underlying quantities and the appropriate capacity weights.
EIA’s refinery utilization and capacity table presents gross input, capacity and utilization together. Its unit labels and area selectors are part of the data, not optional background. Preserve them when exporting a series or making a chart.
What can cause utilization to change?
A change in reported activity raises an operational question before it supports a market conclusion. Maintenance, an unexpected outage, feedstock constraints and changes in processing economics are possible explanations to investigate. The ratio itself does not identify which one occurred.
Timing helps distinguish hypotheses. A temporary drop followed by a rebound has a different pattern from a persistent reduction accompanied by a capacity change. Compare similar periods, inspect regional detail and look for dated evidence about the facilities relevant to the observation.
Avoid assuming that every decline means consumers bought less fuel. A processing interruption can reduce crude intake even if demand for finished products remains strong. Conversely, high processing intensity does not prove that every resulting product will be absorbed immediately.
Read the crude and product sides together
Refining links raw-material availability with finished-fuel supply. When you investigate a utilization move, examine crude inputs and inventories on one side, and product output and stocks on the other. The purpose is to test a mechanism rather than force all the series to move in the same direction.
Consider a hypothetical outage. Lower processing could leave more crude unprocessed while reducing the flow of some products. That would make a crude build and pressure on product supply logically compatible. Whether this happened in an actual week still requires the relevant flow and inventory evidence.
Product consumption measures also need care. EIA’s explanation of product supplied describes its consumption proxy and the value of a four-week average. A weekly utilization rate and a product-supplied estimate answer related questions at different points in the chain.
A practical workflow for comparing refinery data
Begin by recording the geography, frequency, unit boundary and capacity convention. Then inspect the input and capacity levels behind the rate. Check whether the change survives a comparison with nearby observations and with an appropriate seasonal period.
If you compare countries, do not assume that their utilization measures share the same denominator or plant coverage. Readers in India and Pakistan should consult the definitions accompanying the relevant local series before putting it beside the U.S. measure. A common percent sign does not make the measures identical.
Next verify any proposed operating explanation at its source. CrowdSent’s market-news verification guide helps distinguish a confirmed outage from an unattributed claim. Keep the location and date of that evidence close to the data point you are explaining.
Use a research journal to retain the calculation and alternative explanation. A concise note might say: “Utilization rose; gross input was unchanged; the denominator decreased.” That is a stronger observation than “refineries became busier” when the numbers do not support that wording.
Frequently asked questions
1. What does 90% refinery utilization mean?
For the defined series, gross input is equal to 90% of the stated capacity denominator. It does not mean every refinery or processing unit runs at exactly 90%. The aggregate can contain plants operating at different rates.
2. Is refinery utilization the same as crude oil production?
No. Production concerns extracting crude; utilization concerns processing activity relative to capacity. A country can import crude for refining, export domestic production, or do both. The two measures belong to different stages of the supply chain.
3. Can utilization rise without more oil being processed?
Yes, if the comparable capacity denominator falls while input stays unchanged. That is why the underlying levels matter. Recalculate the ratio and explain which component changed before attributing a higher rate to stronger activity.
4. Why should I avoid using crude-only input in the formula?
The official gross-input numerator may include other eligible materials. Substituting a narrower series changes the calculation. Use the specified gross-input figure when reproducing the official utilization rate, or clearly label an alternative measure.
5. Does 100% mean an absolute physical maximum?
Interpret it relative to the stated capacity convention. Calendar-day capacity incorporates operating allowances, so it is not identical to an optimal stream-day maximum. An unusually high reading calls for a definition and data check rather than an automatic conclusion that it is impossible.
6. Why can a national rate hide a regional problem?
Activity in other regions can offset the affected area’s decline. Compare the relevant regional quantities with the aggregate. The national rate can remain stable even when a particular delivery region experiences a meaningful processing interruption.
7. Does higher utilization guarantee lower gasoline prices?
No. The rate does not by itself establish gasoline output, inventory availability, distribution conditions or demand. Price interpretation requires those additional pieces of evidence and should remain conditional rather than mechanical.
8. Can I average two regional percentages to obtain the total?
Only an appropriately capacity-weighted calculation reproduces a combined utilization ratio. Add compatible input quantities and divide by combined capacity. An equal-weight average is misleading when the regions have different capacities.
9. Should I compare weekly and monthly utilization directly?
They summarize different intervals and may reflect different data processes. A single week can be unusual within a month. Keep frequency consistent for trend comparisons, and consult the publisher’s notes when reconciling the series.
10. What should I record when utilization falls sharply?
Record input, capacity, geography, period and any revision or explanatory note. Then look for verified operational evidence. Preserve an alternative explanation if the cause remains uncertain; the percentage alone does not settle it.
Conclusion: keep the denominator in view
Refinery utilization is most useful when read alongside its input and capacity components. That separates a genuine throughput change from a denominator effect and makes regional comparisons more reliable. Product output and inventories can then help explain the wider consequences.
This educational article does not provide investment advice.
Source documentation checked 11 October 2026. Educational explanation from the CrowdSent Blog Team. Numerical examples are hypothetical unless explicitly identified otherwise. This article does not provide investment recommendations.