

Non-GAAP earnings adjust a profit measure calculated under the applicable accounting standards. To understand an adjusted result, start with the comparable reported figure, follow every signed adjustment and rebuild the total. The label alone does not explain the calculation.
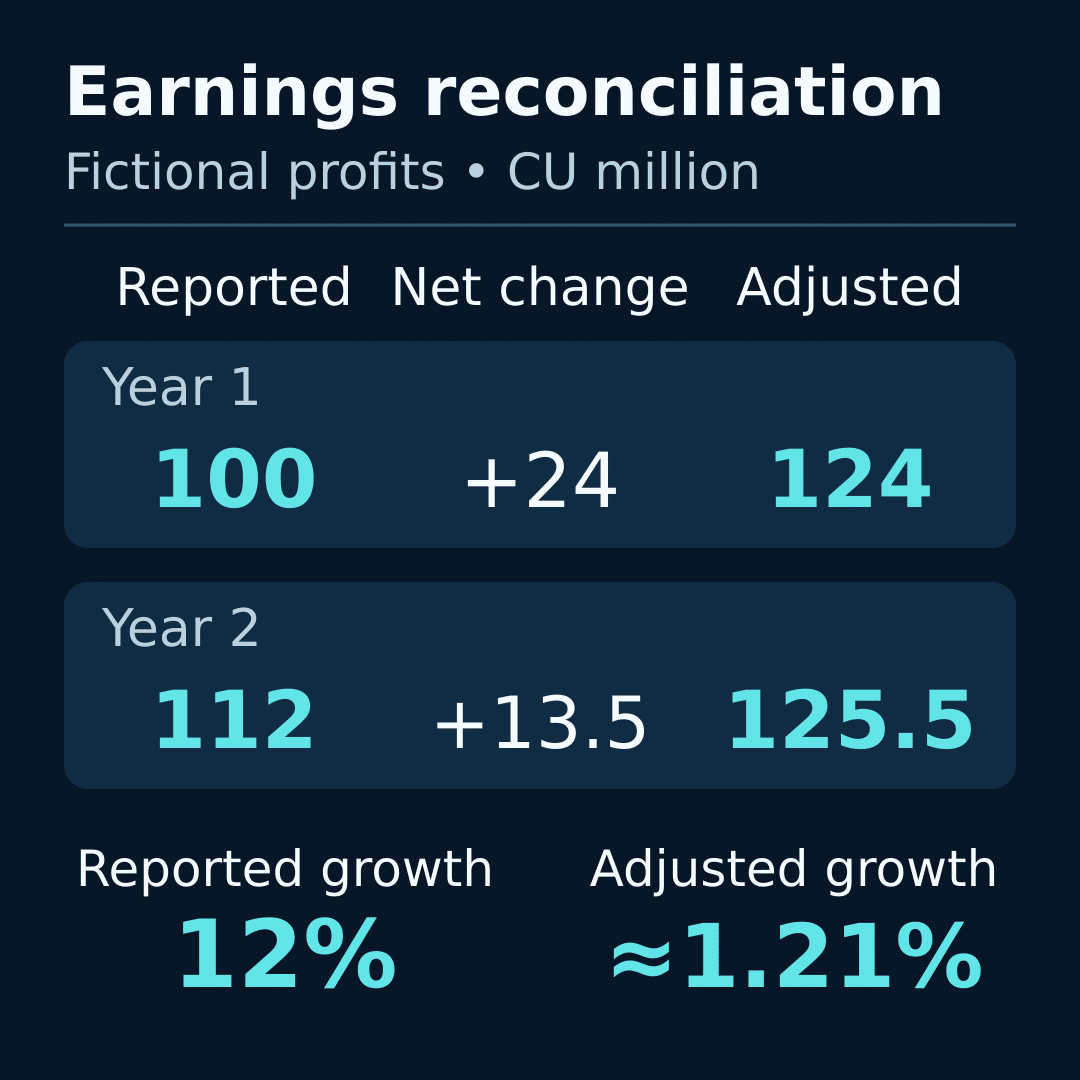
A fictional two-year reconciliation shows how reported profit can grow 12% while a company-defined adjusted figure grows about 1.2%. Both growth calculations can be correct. The difference lies in what changed between the starting and ending measures.
Identify the non-GAAP earnings definition first
Copy the exact measure name, period, reporting boundary and units from the report. “Adjusted profit” without a definition is an incomplete data label. Keep it on a separate line from the reported result rather than replacing one with the other.
The SEC Financial Reporting Manual, Topic 8 describes non-GAAP measures and reconciliation to comparable GAAP figures within the US framework. This article uses that source for reporting literacy; it does not apply US disclosure rules to every company or jurisdiction.
In the exercise below, reported profit means the starting profit after tax. Adjusted profit means only the fictional company’s stated calculation. The example illustrates how to inspect a definition, without endorsing its exclusions or making a compliance conclusion.
Rebuild the signed adjustment bridge
Assumptions: all figures are fictional CU million, for equal annual periods and the same reporting boundary. The associated tax effects are supplied inputs. There are no per-share or share-count calculations.
Year 1: reported profit is CU100. Add CU25 of restructuring expense and CU15 of share-based compensation expense. Remove a CU10 asset-sale gain, then include a separate negative CU6 associated tax adjustment. Company-defined adjusted profit is 100 + 25 + 15 − 10 − 6 = CU124.
Year 2: reported profit is CU112. There is no restructuring adjustment or asset-sale-gain adjustment. Add CU18 of share-based compensation and include a separate negative CU4.5 tax adjustment. The adjusted result is 112 + 18 − 4.5 = CU125.5.
Use a sign column when reconstructing this bridge. Removing an expense raises the illustrated profit; removing a gain lowers it. A worksheet that adds both the CU25 charge and CU10 gain would produce the wrong endpoint even if every input were copied accurately.
The net adjustment is CU24 in Year 1 and CU13.5 in Year 2. Reverse the bridge as a check: CU124 minus CU24 recovers CU100; CU125.5 minus CU13.5 recovers CU112. Keep gross rows visible so these net differences remain explainable.
Calculate growth using matching endpoints
Reported growth = (112 ÷ 100 − 1) × 100 = 12%. Adjusted growth = (125.5 ÷ 124 − 1) × 100 ≈ 1.21%. Each uses the same definition in both years.
The adjusted-profit gap narrows from CU24 above reported profit to CU13.5 above it. That is a CU10.5 reduction in net adjustments. Reported profit increases CU12, while adjusted profit increases only CU1.5. The cross-check is CU12 − CU10.5 = CU1.5.
You can also trace the CU10.5 reduction row by row. The restructuring add-back falls CU25, the compensation add-back rises CU3, removal of the asset-sale gain disappears and adds CU10 to the bridge change, and the tax adjustment becomes CU1.5 less negative. Together: −25 + 3 + 10 + 1.5 = −10.5.
A mixed calculation, CU125.5 divided by CU100 minus one, gives 25.5%. It compares Year 2 adjusted profit with Year 1 reported profit. That percentage is not either growth rate described above. Giving each worksheet row a persistent definition prevents this accidental change of basis.
The arithmetic supports an explanation of reported and adjusted growth. It does not establish how a market price should respond, whether management’s chosen exclusions are economically useful or which result a reader should prefer.
Examine the pattern behind the exclusions
The SEC’s non-GAAP interpretations discuss recurring costs, consistency between periods, treatment of gains as well as charges, and separately explained tax effects. These are US regulatory observations; the following questions are a practical way to examine the fictional bridge.
First, share-based compensation is excluded in both years, rising from CU15 to CU18. Record that repeated pattern and ask what management’s definition is intended to measure. The recurring row remains economically relevant to understanding the business, even though this particular presentation removes it.
Second, the Year 1 bridge removes an asset-sale gain rather than retaining only favourable adjustments. If you accidentally omit its negative CU10 line, Year 1 adjusted profit becomes CU134. That ten-unit difference demonstrates why gains deserve the same line-by-line attention as charges.
Third, keep CU6 and CU4.5 as supplied tax adjustments. They should not be replaced with a rate borrowed from another company or country. The example provides enough information to check the addition, but not enough to audit the tax calculation behind those inputs.
Keep cash and assurance questions separate
The bridge moves between two profit definitions. It contains no bank-balance record and does not show when the restructuring payments occurred. Adding CU25 back to Year 1 profit therefore cannot tell you how much cash was available at year-end.
Likewise, the arithmetic check demonstrates that the stated rows sum to CU124 and CU125.5. It does not establish audit assurance over the adjusted presentation. If assurance matters to your research question, locate the relevant report and check what it covers.
This distinction keeps a narrow calculation useful: “I reproduced the adjusted-profit reconciliation” is a supportable statement. “I verified cash availability” would require evidence absent from this exercise.
Preserve the definition with the comparison
Save the starting measure, adjustment labels, signs, tax row, endpoint and prior-period method. Include the source page and report version. If the definition changes, retain both the old and new descriptions rather than silently rewriting historical values.
Use the market-news verification checklist when a headline omits the bridge. Record unresolved differences in a market research journal instead of inventing a balancing adjustment.
A clear final summary for the example is: “Reported profit rose 12%; the stated adjusted measure rose about 1.21%, as net adjustments narrowed by CU10.5 million.” It names both measures and explains the numerical difference without assigning motives to an issuer.
Frequently asked questions
Are adjusted earnings and diluted EPS the same distinction?
No. This example changes the earnings definition while keeping every calculation in total CU million. Diluted EPS concerns a per-share measure and potential-share effects. Do not treat “adjusted” and “diluted” as interchangeable labels.
Does non-GAAP mean the number is fraudulent?
The term identifies a different measurement basis, not proof of fraud. Examine its definition, reconciliation and context. This article’s fictional CU124 can be reproduced arithmetically without making a claim about any real issuer’s conduct.
Is there one universal adjusted-profit formula?
No. Read the particular definition. Here it includes restructuring, compensation, gain and tax rows. A different company could use a different set, so copying only the final number would discard essential comparison information.
Can adjusted earnings be lower than reported earnings?
Yes. Consider a separate fictional bridge: CU100 reported profit minus a CU30 gain plus a CU10 expense add-back equals CU80 before any further adjustments. The direction follows the signed rows, not the word “adjusted.”
Why should gains and charges be checked together?
The fictional Year 1 result is CU124 after removing the asset-sale gain. Omitting that negative CU10 row produces CU134. A review that checks only expense add-backs would miss the changed result.
Does calling a cost one-off prove it will never recur?
No. Compare the label with the period-by-period record and the underlying activity. In this exercise, compensation appears in both years; the repeated numbers remain visible regardless of how a presentation describes them.
Why show the tax adjustment separately?
Separate rows reveal the gross adjustment and its associated tax effect. The CU6 and CU4.5 inputs can be checked within the bridge without pretending they arise from a universal tax rate.
Can two companies’ adjusted figures be compared directly?
First align their definitions, scope and periods. A company that excludes CU15 of compensation and one that retains the same expense have different calculation bases. Matching labels alone cannot remove that difference.
Is a required segment-profit measure automatically non-GAAP?
No. The SEC manual distinguishes required segment information consistent with the relevant accounting standard from non-GAAP measures. Check its reporting context and definition rather than classifying a measure solely because its label is unfamiliar.
What if I cannot reconcile the published numbers?
Check units, rounding, scope, signs and source versions first. Keep any remaining unexplained difference visible, together with the missing information. Forcing the endpoint to match with an invented adjustment would undermine the entire comparison.
Sources checked 13 October 2026. Educational content only. All numerical examples are fictional and are not current market data or investment recommendations.