

Inventory turnover compares the cost of goods sold during a period with the average inventory carried during that period. It describes how much cost flowed through sales relative to stock on hand. The ratio becomes useful when its accounting basis and operating context are clear.
A higher result can accompany faster selling, smaller stock holdings or a change in product mix. It can also appear after an inventory reduction that says little about physical sales. This article uses hypothetical figures to separate the calculation from those possible explanations.
Inventory Turnover: use a cost-based numerator
The standard calculation is cost of goods sold divided by average inventory. The SEC’s financial statement guide gives this formula and illustrates an opening-and-closing balance average. Revenue usually includes a margin above inventory cost, so substituting sales changes what the ratio measures.
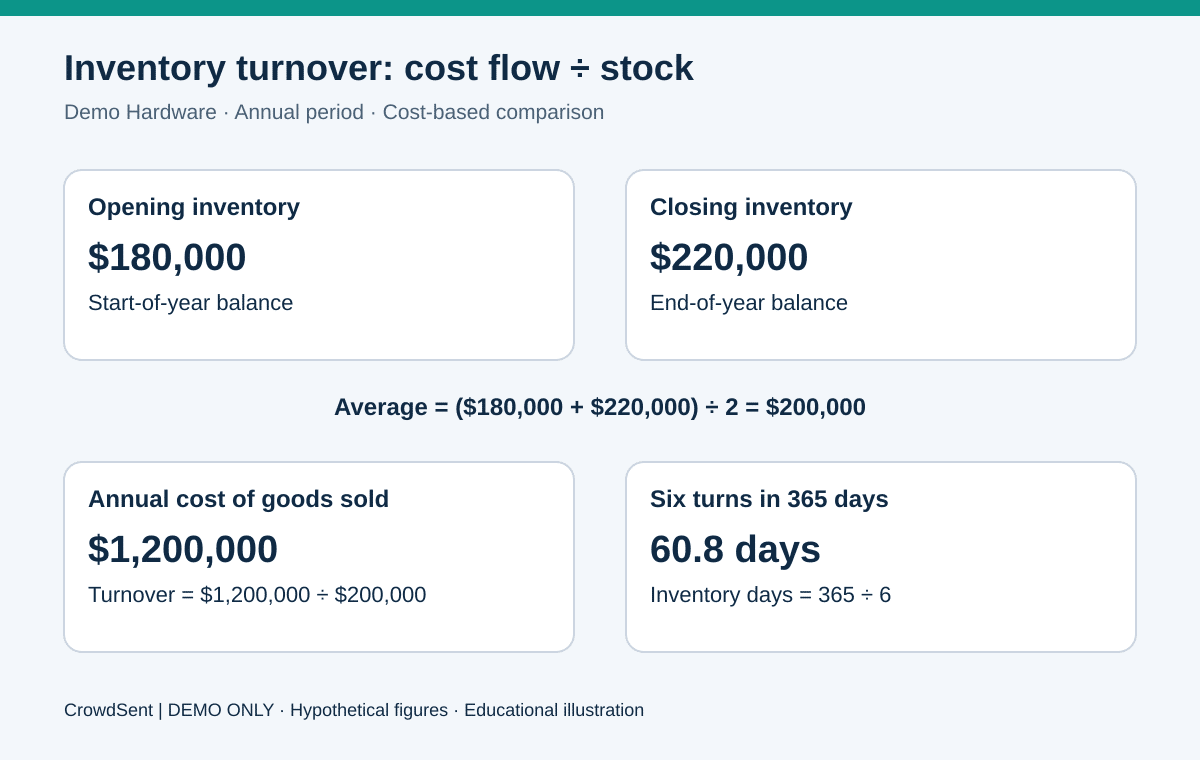
Suppose Demo Hardware begins a year with $180,000 of inventory and ends with $220,000. Its simple average inventory is $200,000. With annual cost of goods sold of $1.2 million, inventory turnover equals $1.2 million ÷ $200,000 = 6 times.
That calculation compares dollars of cost recognized through sales with dollars held as inventory. It does not mean every item was replaced exactly six times. One fast-moving product could account for much of the numerator while another sits on the shelf throughout the year.
Translate turnover into inventory days
Using a 365-day convention, inventory days equal 365 ÷ 6, or approximately 60.8 days. The equivalent calculation is $200,000 ÷ $1.2 million × 365. The two formulas reconcile because they use the same period, cost flow and average balance.
For a 90-day quarter, a turnover result of 1.5 times corresponds to 60 days: 90 ÷ 1.5. Dividing 365 by that quarterly ratio would mix periods. A separately annualized ratio can be useful, but it must state the assumption that the quarter represents a full-year run rate.
ACCA’s ratio analysis guidance describes the inventory holding-period approach. Expressing the same relationship in days can make an operating discussion easier, but it does not transform a financial ratio into a direct observation of each item’s age.
Test average inventory before interpreting inventory turnover
Imagine Demo Hardware’s detailed monthly records produce an average inventory of $300,000 because it held much more stock before a seasonal selling period. The same $1.2 million cost of goods sold now yields four turns and 91.25 days. Opening and closing balances missed the peak.
Neither arithmetic result is mysteriously wrong. They answer the question using different representations of stock held during the year. The monthly average contains more information about this fictional operating pattern. Daily balances could refine it further if the records are reliable and the additional precision matters.
An inventory turnover comparison should preserve its averaging method. If the first year uses two endpoints and the second uses twelve monthly observations, a change in turnover partly reflects measurement. Record the balance dates and averaging approach before comparing the resulting figures.
Separate quantity changes from valuation changes
Under IAS 2, inventory measurement includes costs needed to bring items to their current location and condition, with a lower-of-cost-and-net-realisable-value requirement. The IFRS Foundation’s IAS 2 overview also explains cost formulas and recognition of inventory costs as expense when related revenue is recognized.
These accounting choices matter when interpreting a cost-based ratio. Suppose two hypothetical averages are $200,000 and $160,000 while the chosen numerator stays $1.2 million. The arithmetic rises from six to 7.5 turns solely because the denominator falls. That sensitivity calculation does not establish that more units sold.
A real write-down can affect both inventory and the expense numerator, depending on classification and the reporting period. Examine the disclosed adjustment rather than treating the simplified sensitivity as a complete journal-entry model. Units sold, inventory age and write-down disclosures help distinguish operating movement from measurement effects.
Read turnover alongside availability and mix
Picture a store with two product groups. Essentials sell frequently and have short replenishment lead times. Specialty parts sell slowly but are deliberately stocked for customers who need immediate availability. Combining them can conceal both a stockout in essentials and an obsolete specialty line.
A useful follow-up breaks the average into meaningful categories and asks which changes explain the total. Faster turnover accompanied by fewer lost sales differs from faster turnover caused by empty shelves. Slower turnover from a planned launch differs from slow-moving goods with no realistic demand.
Cross-company comparison also needs boundaries. A distributor carrying finished goods differs from a manufacturer holding raw materials, work in progress and finished products. Outsourcing, consignment terms and accounting methods can change reported stock. There is no universal number that proves inventory is being managed well.
Save a compact reconciliation: cost of goods sold, inventory balances, period length, averaging method and important adjustments. Then add the operational evidence that explains the movement. The ratio summarizes a relationship; the supporting records tell the reader whether that relationship is improving for a useful reason.
Frequently asked questions
1. What does six-times inventory turnover mean?
The period’s cost of goods sold equals six times the average inventory measured on the selected basis. It does not describe the sales frequency of every individual item.
2. Why use cost of goods sold instead of revenue?
Inventory is normally carried on a cost-based accounting basis. A revenue numerator includes the selling margin and creates a different measure, so it should be labeled separately.
3. How do I calculate average inventory?
A simple version adds opening and closing inventory and divides by two. More frequent observations can represent seasonal or rapidly changing stock levels more faithfully.
4. Is 365 always the correct divisor for inventory days?
Use the day count corresponding to the numerator period. A 90-day quarter requires 90 days unless you explicitly annualize the flow and explain the assumption.
5. Does higher turnover guarantee fewer obsolete goods?
No. A fast-selling product line can dominate the aggregate while old items remain. Review age bands, product categories and write-down disclosures alongside the overall ratio.
6. Can an inventory write-down change turnover?
Yes. It can reduce the balance and may affect the expense numerator. Identify both effects and their timing before describing a higher result as faster physical sales.
7. Does a higher selling price directly improve cost-based turnover?
Not by itself. If unit volume, cost of goods sold and average inventory remain unchanged, a higher revenue figure does not enter this particular formula.
8. What happens when average inventory is zero?
The ratio cannot be calculated with a zero denominator. A negligible or irrelevant inventory balance may also make turnover unsuitable for understanding that business.
9. Should raw materials and finished goods be combined?
A total can summarize the balance sheet, but category analysis may explain bottlenecks better. Use cost flows that meaningfully correspond to each category rather than forcing one denominator.
10. Is lower inventory always desirable?
The required stock depends on lead times, demand variability and service expectations. An inventory reduction that prevents orders being filled can create costs absent from the ratio.
Keep the source date, units, reporting boundary and calculations together in a market research journal so later comparisons can be reproduced.
Sources and further reading
Educational examples only. Figures are hypothetical and do not provide investment, tax or accounting advice.
Explore CrowdSent membership.