

Initial jobless claims and continuing claims describe different parts of the unemployment-insurance process. Initial claims record applications that start an eligibility determination after a separation from an employer. Continuing claims concern subsequent weeks of unemployment claimed by people who have already filed.
A useful shorthand is flow versus stock: initial claims describe incoming claim activity, while continuing claims approximate the ongoing pool of insured unemployed workers claiming benefits. The shorthand has limits. These are administrative counts, and some tables count weeks claimed rather than unique people.
To read the weekly report, establish the series, reference week, program coverage and revision status before deciding what changed. A headline release date does not guarantee that all its figures describe the same week.
What the two jobless claims measures tell you
Initial claims can provide an early indication of changing labor-market conditions among people entering the claims process. Filing does not establish that a claim has been approved or that payment has occurred.
Continuing claims, also called continued claims or insured unemployment in the regular-state-program headline series, relate to ongoing claims after the initial filing. They help describe persistence within the covered claims population.
The Department of Labor’s weekly claims report and technical notes define both measures. The report distinguishes the regular-state headline data from additional tables covering other programs, and provides separate week-ending dates.
A sustained increase in continuing claims can be consistent with a larger pool remaining in the system. But the total alone cannot identify how much reflects new entrants, slower exits, eligibility changes or administrative effects. That requires additional evidence.
Use the flow-versus-stock analogy carefully
Hypothetical teaching example: imagine a small, simplified register with 100 people at the start of a week. Twenty people enter, and 15 leave. The ending register contains 100 + 20 − 15 = 105 people.
Now imagine that only 15 enter the next week, but just five leave. The register rises again, from 105 to 115, even though entries fell. A falling inflow and a growing ongoing pool can therefore coexist.
This is an illustration of stock-flow reasoning, not an identity for the published claims tables. Real initial claims do not mechanically become continuing claims one week later. Eligibility, processing, reference periods, program definitions and multiple weeks claimed complicate that connection.
The illustration also shows why subtracting initial claims from continuing claims does not calculate job finding. The two published numbers are not a matched cohort ledger with all entrances and exits observed.
Match the reference weeks before making a comparison
The report’s newest initial-claims observation typically refers to a more recent week than its newest regular-state insured-unemployment observation. Other tables can have another lag. Read each week-ending label rather than copying the release date into every row.
Hypothetical release: initial claims of 230,000 refer to the week ending October 10, while continuing claims of 1.82 million refer to the week ending October 3. Those figures can appear in one document without being simultaneous measurements.
If a chart labels both points only with the release date, it is showing an information-arrival timeline. A chart labeled by reference week is showing when the reported activity occurred. Either can be useful, but they answer different questions.
Keep those timelines separate when comparing claims with news. A development that first occurred this morning could not have caused claim activity in a reference week that ended earlier.
Read revisions before calculating the weekly change
Advance figures are updated as state reporting develops. The DOL notes distinguish advance reporting from the following reporting round. A new release can therefore change both the latest observation and the previous week’s baseline.
Hypothetical revision example: last week’s initial estimate was 218,000. This week, that value is revised to 222,000 and the new observation is 230,000. The change against the revised prior week is 8,000. Comparing 230,000 with the old 218,000 gives 12,000 and mixes two data vintages.
Both numbers can appear in an honest discussion if clearly labeled. For the latest official week-to-week comparison, use the baseline in the latest release. For research about what people knew last week, preserve the older release rather than silently replacing it.
Historical seasonal factors and unadjusted observations can also be revised. Store the release or download date with a dataset so a later difference is not automatically mistaken for a calculation error.
Seasonal adjustment and the four-week average do different jobs
Seasonal adjustment aims to reduce recurring calendar-related patterns. Holidays, weather-sensitive activity and school schedules can affect the weekly series. The Bureau of Labor Statistics explains the current approach in its weekly claims seasonal-adjustment methodology.
A four-week average instead smooths four consecutive observations. It does not make them seasonally adjusted by itself. A series can be both seasonally adjusted and averaged, and the report’s labels identify which transformation has been applied.
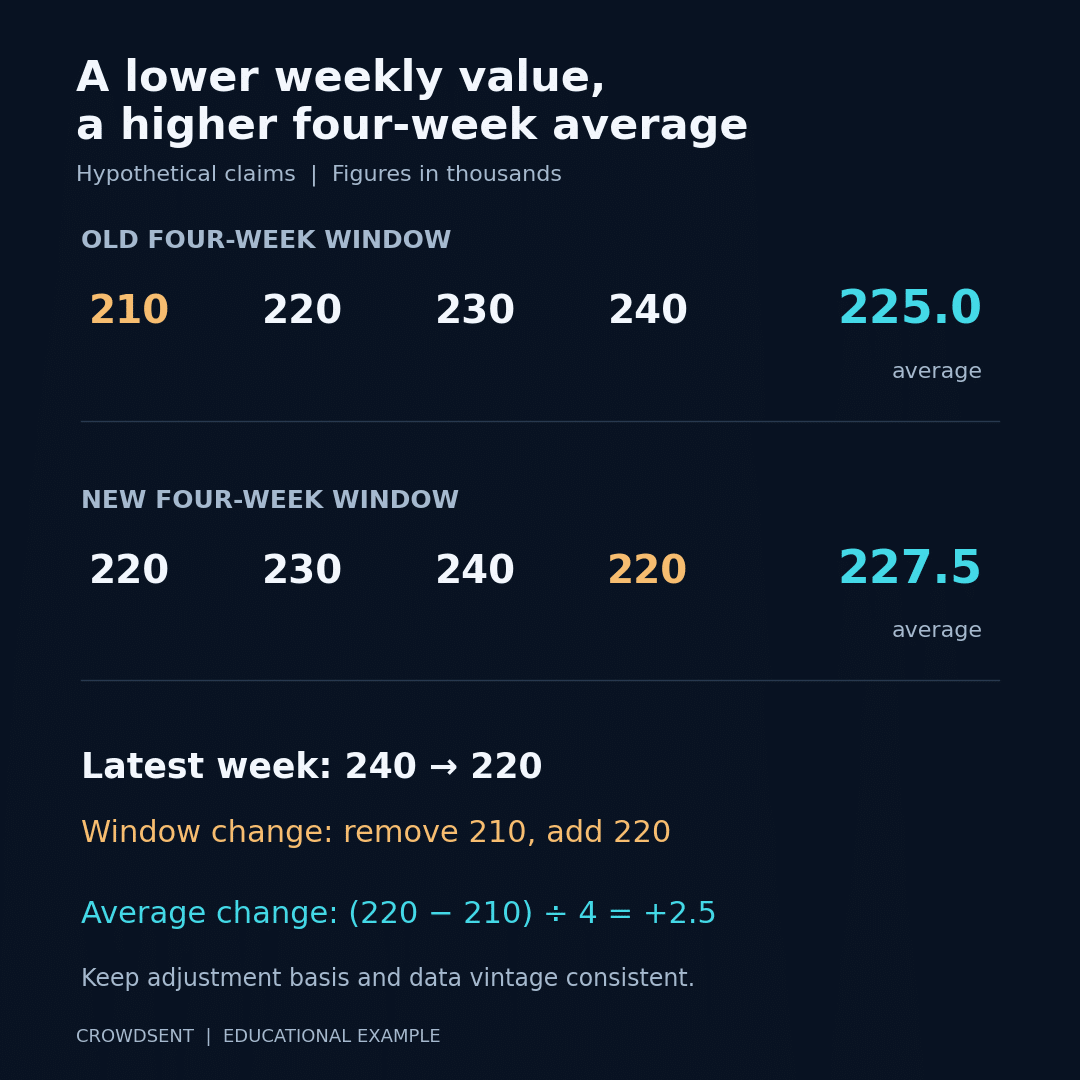
Hypothetical calculation: four comparable weekly observations of 210,000, 220,000, 230,000 and 240,000 average 225,000. If the next week is 220,000, the new four-week window drops 210,000 and adds 220,000. Its average becomes 227,500, even though the latest weekly value fell from 240,000.
That result is arithmetic, not a contradiction. A moving average depends on the observation entering and the one leaving the window. Use the same adjustment basis and data vintage for all four inputs.
Coverage limits the conclusions
Unemployment insurance operates under eligibility rules. Someone without work may not qualify, may not apply, or may no longer have benefits available. The system is therefore not a census of everyone without a job.
The DOL’s unemployment-insurance overview explains that states set eligibility requirements. The consequences for analysis are straightforward: changes in claims can reflect participation in a defined program as well as changing labor conditions.
The insured unemployment rate also has its own denominator, covered employment. It is not the national unemployment rate from the household survey. BLS’s explanation of claims and unemployment measurement clarifies that survey unemployment does not depend on benefit eligibility or receipt.
Nonfarm payroll employment is another distinct measure. Its monthly job count is not obtained by subtracting weekly initial claims. Claims can add timely context to labor research without being a substitute for the broader employment reports.
A disciplined weekly reading checklist
- Identify initial claims, continuing claims or an all-program weeks-claimed total.
- Copy each reference week separately from the release date.
- Confirm regular-state or broader program coverage.
- Label seasonally adjusted and unadjusted figures explicitly.
- Record the revised prior week before calculating the change.
- Compare the latest value with its four-week average and a longer consistent history.
- Read state comments and technical notes for documented disruptions.
- Separate the observation from any explanation or market narrative.
Our guide to verifying market news helps trace headlines back to the release. Keep both the observation and its source in a market research journal, and treat a missing observation as missing rather than as zero.
Frequently asked questions
1. Does “initial” mean the first claim in someone’s lifetime?
No. It refers to the administrative initial-claims category, not a lifetime count of first-time unemployment. Claims systems can include new claims and additional claims associated with a new unemployment spell during an existing benefit year.
2. Are continuing claims exactly the number of unique unemployed people?
No. The headline is a useful approximation of ongoing insured unemployment, while weeks-claimed tables count claim activity. The DOL specifically cautions that continued weeks claimed across programs are not a count of unique individuals.
3. Can initial claims fall while continuing claims rise?
Yes. Fewer new filings can coexist with a larger ongoing pool. Different reference weeks and administrative factors also matter, so the combination alone does not quantify how quickly people are finding work.
4. Does a drop in continuing claims prove people found jobs?
No. Return to work is one possible reason for leaving the claims population, but benefit exhaustion or other eligibility and filing changes can also matter. The headline total does not identify every exit’s cause.
5. Why is the insured unemployment rate lower than the national rate?
The measures cover different populations and use different denominators. One concerns insured unemployment relative to covered employment; the national rate comes from a household survey and its labor-force definition. Their levels are not directly interchangeable.
6. Can I sum initial claims to count unique job losses over a year?
Not reliably. A cumulative claims total is administrative activity, not a deduplicated count of people or jobs lost. Repeat unemployment spells and the gap between applications and eligibility prevent that simple interpretation.
7. Why can adjusted claims fall while unadjusted claims rise?
The seasonal method accounts for expected recurring patterns. An unadjusted rise smaller than the model’s seasonal expectation can coexist with a seasonally adjusted decline. Read the adjustment basis before comparing the signs.
8. Why can the four-week average rise after a lower weekly number?
The rolling window replaces its oldest observation. If the incoming value exceeds the outgoing value, the average rises, even when the incoming value is below the immediately preceding week. The worked example shows this explicitly.
9. Should I use the original or revised prior week?
Use the latest revised baseline for a current comparison. Use the original vintage when studying what information was available at a past moment. Label the choice so readers can reproduce the result.
10. Does one unusually high week establish a recession?
No. One observation can reflect volatility, timing or a specific disruption. Examine persistence, revisions, program notes and other labor data before making a broader interpretation. Claims are one source of evidence, not a standalone economic verdict.
Keep the research process consistent
To explore the workspace and its membership options, open CrowdSent.
Educational note: This article explains public labor-market data for research. It is not investment advice or a benefits-eligibility determination. All numerical examples are hypothetical.