

GDP vs GDI compares two estimates of the same domestic economic activity. GDP approaches production through final expenditures. Gross domestic income approaches it through the incomes earned and costs incurred in producing that output. In principle they agree; measured data can leave a gap.
In the US national accounts, that signed gap is the statistical discrepancy: GDP minus GDI. Keeping the subtraction order explicit is important. A positive discrepancy means measured GDP is higher than measured GDI; a negative one means measured GDI is higher.
GDP vs GDI: understand what the two estimates share
BEA’s GDI definition identifies it as an income-and-cost measure of domestic production. It is broader than household wages or take-home pay. The domestic production boundary remains the same when the measurement approach changes.
A simple business illustration helps. A final sale produces revenue that supports compensation, input costs and other production-related claims. Economy-wide accounting separates intermediate purchases so their value is not repeatedly counted as new final output. The expenditure and income approaches describe related sides of that production process.
Real statistical systems do not obtain every transaction from one perfectly synchronized ledger. BEA’s GDP and GDI FAQ discusses differences in sampling, coverage and recording time across their sources. That is why the conceptual equality does not guarantee identical published estimates.
Calculate the discrepancy and its scale
Suppose annual current-price GDP is 1,000 billion currency units and current-price GDI is 980 billion. The statistical discrepancy is 20 billion: 1,000 minus 980. Relative to GDP, it is 2 percent, calculated as 20 divided by 1,000, multiplied by 100.
For the preceding year, suppose GDP was 950 and GDI was 960. Its discrepancy was minus 10, approximately minus 1.05 percent of GDP. The change in the discrepancy is 30 billion, from minus 10 to plus 20. That change is different from the latest discrepancy’s level of 20.
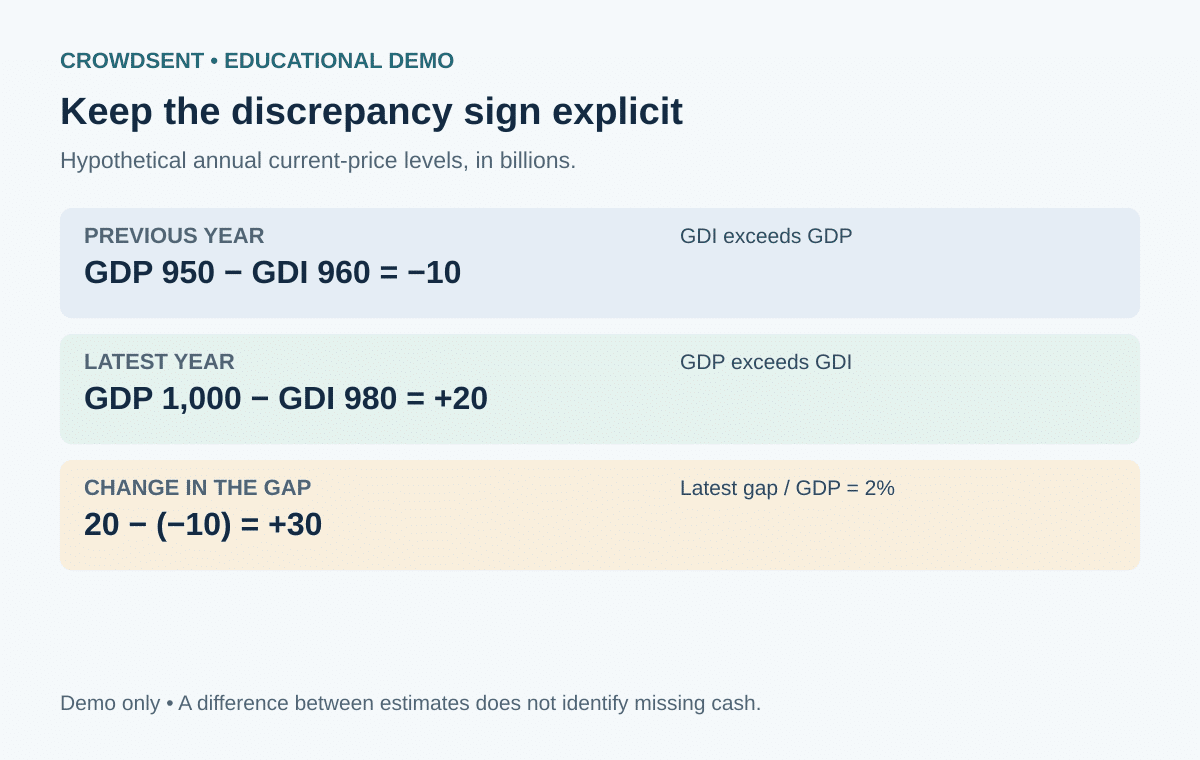
The GDP vs GDI figures are invented, consistently defined annual levels. A positive 20 does not identify a missing bank balance, an unpaid bill or 20 billion of concealed activity. It states how far apart these two estimates stand under the sign convention.
Relate the gap to differing growth readings
GDP in the example rises by 50, from 950 to 1,000, or about 5.26 percent. GDI rises by 20, from 960 to 980, or about 2.08 percent. The difference between their dollar changes is 30, matching the change in the discrepancy.
The gap between their growth rates is about 3.18 percentage points. That growth-rate gap cannot be substituted for the discrepancy as a percentage of GDP. Each growth rate uses its own earlier-period denominator, whereas the discrepancy ratio compares simultaneous levels.
This distinction is particularly useful when headlines emphasize conflicting growth. First ask whether both series rose or fell, then compare their rates using matching conventions. A slower income estimate does not automatically mean the income level is below its previous value.
Read revisions as new information
Suppose a later release revises the latest GDP estimate to 1,008 and GDI to 1,005. The discrepancy shrinks to three, about 0.30 percent of revised GDP. GDP rose eight relative to its earlier estimate while GDI rose 25. The narrowing can be explained without assuming either original estimate was a complete record of the economy.
BEA’s study of GDP and GDI revisions explains the use of preliminary information and later, more comprehensive sources. It also notes that differences can persist after benchmark revisions. A small discrepancy is therefore not proof that all underlying components are precisely measured.
To study a revision, save both releases. Recalculate the discrepancy within each vintage and then compare the results. Subtracting last month’s GDI from this month’s revised GDP creates a hybrid that may never have appeared in an official release.
Use the average with a clear purpose
BEA also publishes an average of real GDP and real GDI as a supplemental activity measure. An average can summarize two readings without determining which measurement errors occurred. It should retain its own name rather than be silently substituted for the GDP headline.
As a separate arithmetic illustration using our current-price levels, the earlier average is 955 and the later average is 990. Their growth is about 3.66 percent. Simply averaging the two separately calculated percentage growth rates gives approximately 3.67 percent. Average the levels first when that is how the specified measure is constructed.
Neither the gap nor an average alone establishes a market outcome, a recession designation or a future revision. A careful GDP vs GDI comparison examines source coverage, vintages, component detail and other evidence. The discrepancy identifies measurement disagreement; explaining its causes requires more information.
GDP vs GDI: common questions
1. Are GDP and GDI supposed to measure different economies?
No. They refer to the same domestic production boundary, using different measurement approaches. The observed discrepancy arises because the underlying estimates are imperfect.
2. Is a negative statistical discrepancy an error in subtraction?
Not necessarily. Under the US convention, GDP minus GDI is negative whenever the published GDI level exceeds GDP. Keep that convention visible in any comparison.
3. Does GDI equal household disposable income?
No. GDI covers production-related incomes and costs across the economy. Household disposable income has a different scope and includes its own tax and transfer adjustments.
4. Is the discrepancy the same as the GDP-GNI difference?
No. GDP and GNI differ in their treatment of cross-border primary income. GDP and GDI share the domestic boundary and differ because of measurement sources.
5. Is this the same residual seen in chained-dollar component tables?
No. Chain-index nonadditivity concerns aggregation of separately chained volume components. The GDP-GDI discrepancy concerns independently estimated expenditure and income totals.
6. Can I compare nominal GDP with real GDI?
That would mix price bases and create an uninterpretable subtraction. Use matched current-price levels for the nominal discrepancy or the publisher’s explicitly defined real measures.
7. Does a narrowing discrepancy prove one side was originally correct?
No. Both estimates may have changed, and offsetting errors can remain. Inspect the revisions and component evidence before assigning the change to a particular cause.
8. Should I divide the discrepancy by GDP or GDI?
Specify the denominator. This article uses GDP. A ratio divided by GDI is a different statistic and will produce a different numerical result.
9. Will the next release necessarily close the gap?
No. New information can narrow, widen or reverse it. The existence of the discrepancy alone does not establish the direction of a subsequent revision.
10. What belongs in a reproducible discrepancy calculation?
Record the GDP and GDI series, period, units, price basis, adjustment convention and common release date, followed by the subtraction order and denominator for any percentage.
Educational note: All numerical examples are hypothetical demonstrations. This article explains economic statistics and does not provide investment advice or predict market returns.
Explore CrowdSent membership.
Keep the source date, units, reporting boundary and calculations together in a market research journal so later comparisons can be reproduced.