

The GDP deflator describes price change associated with domestic production. It is useful when a GDP release contains both a money value and a volume measure, and you want to understand the price movement connecting them. Its coverage also explains why it can move differently from a household inflation index.
This guide concentrates on the implicit deflator, its arithmetic and its interpretation. The examples use invented annual observations and matched units. They are not current economic readings or forecasts.
GDP Deflator: build the index from matching observations
BEA defines an implicit price deflator as current-dollar value divided by the corresponding chained-dollar value, multiplied by 100. The word corresponding matters: both figures must describe the same aggregate, period, geography and data vintage.
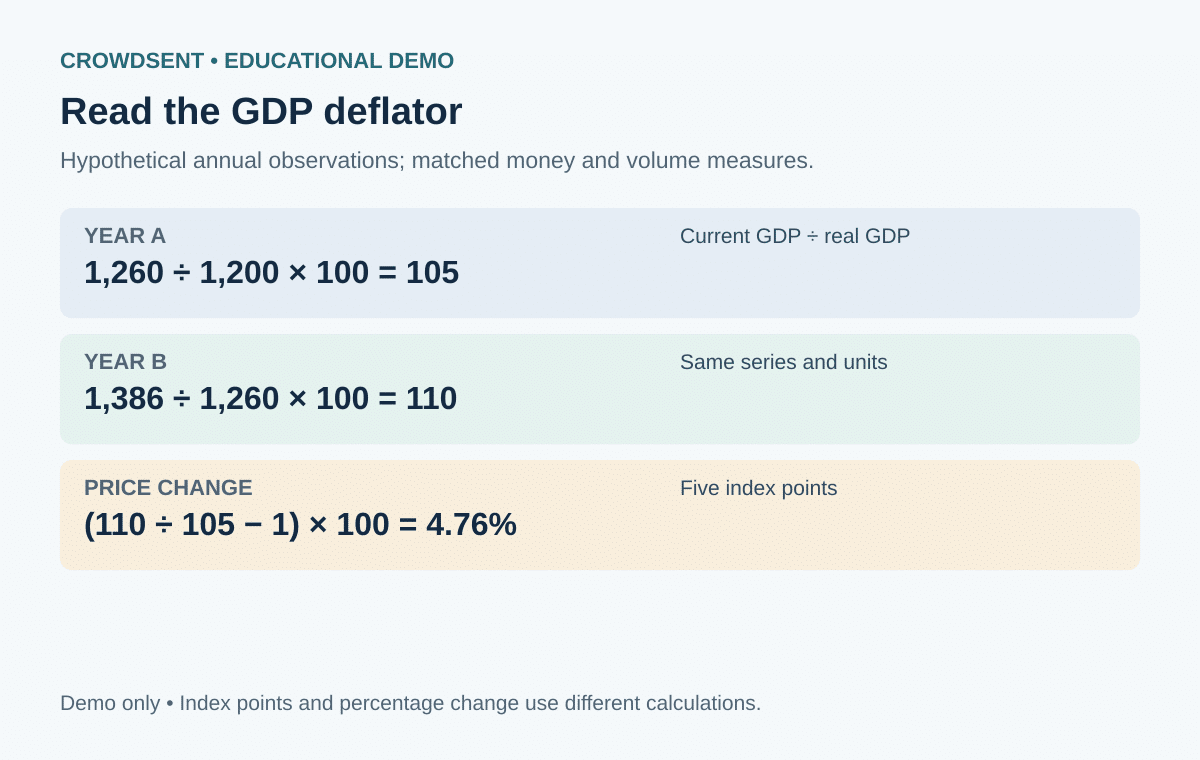
Suppose an economy reports annual current-price GDP of 1,260 billion currency units and a matching real GDP measure of 1,200 billion in reference-year units. Its implicit GDP deflator is 1,260 divided by 1,200, multiplied by 100, giving 105. The index expresses the relationship to its reference normalization. It does not say prices increased 105 percent during that year.
Calculate a rate from two index levels
In the next hypothetical year, current-price GDP is 1,386 billion and real GDP is 1,260 billion. The deflator becomes 110. To calculate the annual price change, divide 110 by 105, subtract one and multiply by 100. The result is approximately 4.76 percent.
The difference between the two index readings is five index points. Reporting that difference as five percent would use the wrong denominator. A move from 100 to 105 is five percent; a move from 105 to 110 is a smaller percentage change because it begins from a higher level.
The same example provides a useful cross-check. Money GDP grew 10 percent, while real GDP grew 5 percent. Dividing the gross growth factors, 1.10 by 1.05, gives 1.047619. Subtracting one recovers 4.76 percent. Simply subtracting the two growth rates gives a five-percentage-point approximation, which misses their multiplicative relationship.
Understand the production boundary
The GDP deflator covers domestically produced output, including investment goods, government services and exports. A consumer index answers a narrower spending question. The BLS comparison of GDP and consumer price measures explains the difference in scope and construction.
Consider a country that exports machinery but imports many household electronics. A change in machinery export prices belongs within the production-price picture. Imported electronics are outside domestic production, although their prices can matter greatly to households. Domestic distribution services associated with selling those electronics are a separate part of domestic value added.
Excluding imports from GDP’s production boundary does not mean import prices are economically irrelevant. They can affect production costs, spending choices and other measured prices. Nor does it mean analysts can remove a single import index from the final GDP deflator and obtain a consumer inflation measure.
Choose a price measure for the question
BEA distinguishes the GDP price index from the gross domestic purchases price index: the former follows domestic production, while the latter covers purchases by domestic consumers, businesses and governments. Their treatment of trade therefore differs. A question about the prices domestic buyers face calls for attention to purchases coverage.
The UK Treasury’s user guide also explains the GDP deflator’s broad coverage and its use in converting monetary series into real terms. A broad benchmark is useful only when its coverage suits the application. A specialized construction budget or a household’s shopping costs may require a more specific index.
For example, imagine a maintenance budget rising from 100 to 106 while the relevant broad deflator rises from 105 to 110. The budget’s deflated growth is 1.06 divided by 1.047619, minus one, or about 1.18 percent. This answers a broad purchasing-power comparison under the chosen benchmark. It does not prove the organization can purchase 1.18 percent more of its particular maintenance services.
Keep the series identity with the number
A useful saved observation includes the exact series name, reference year, period, units and release date. Check whether the publisher reports an implicit deflator or a separately presented chain-type price index. Related price measures can differ under some aggregation conventions, so their labels should remain intact.
If a reference normalization changes, index levels change scale. A pure rescaling preserves percentage changes between periods. Revisions to underlying output, prices or methods can change the growth history itself. Compare like vintages before attributing a difference to economic events.
Frequently asked questions
1. Does a deflator of 110 mean inflation is 10 percent this year?
It means the index stands at 110 relative to its reference normalization of 100. This year’s inflation requires comparison with the preceding year’s index, which may be nowhere near 100.
2. Can the GDP deflator fall?
Yes. A decline indicates falling prices under that aggregate measure over the chosen interval. It does not require every individual price to fall.
3. Should I subtract 100 before comparing two years?
No. Divide the later index by the earlier index, subtract one and multiply by 100. Subtracting 100 is relevant only to a comparison with a reference level of 100.
4. Can I mix quarterly nominal GDP with annual real GDP?
No. Their periods differ. Even if both are expressed in billions, their ratio does not form the intended quarterly or annual deflator.
5. Does an imported product disappear from every GDP component?
Imports can appear in expenditure categories before the import subtraction removes foreign production. Domestic services connected with the product can still contribute to domestic output.
6. Is the implicit deflator a fixed shopping basket?
Do not treat it that way. It is derived from matched aggregate value and volume measures, whose underlying composition and index methodology matter.
7. Can this measure settle a household cost-of-living question?
Only imperfectly. Its production coverage differs from household purchases, and an individual household’s spending mix can differ from a consumer index too.
8. Why might my calculation differ from the published rate?
Displayed GDP levels may be rounded, or you may have mixed releases, periods or price-series definitions. Recheck those inputs before interpreting a small gap.
9. Can a forecast deflator be used like an observed one?
The arithmetic works, but the status differs. Label forecast inputs clearly and retain the forecast date so a later revision is not mistaken for an observed event.
10. What is the shortest accurate description of the example?
The hypothetical deflator rose from 105 to 110, a five-index-point increase equivalent to approximately 4.76 percent annual price growth.
Educational note: All numerical examples are hypothetical demonstrations. This article explains economic statistics and does not provide investment advice or predict market returns.
Explore CrowdSent membership.
Keep the source date, units, reporting boundary and calculations together in a market research journal so later comparisons can be reproduced.