

DSO vs DPO is a comparison between two sides of trade credit. Days sales outstanding estimates how much customer credit remains uncollected relative to sales. Days payable outstanding estimates supplier credit relative to purchases or a stated cost proxy. Both use days, but they measure different flows.
A useful DSO vs DPO comparison starts by identifying which balances belong in each calculation. A business can report identical day counts while carrying very different dollar amounts of receivables and payables. This guide uses a fictional 60-day period to make that distinction visible.
DSO vs DPO: identify customer credit and supplier credit
For this example, DSO equals average trade receivables divided by credit sales, multiplied by days in the period. DPO equals average trade payables divided by credit purchases, multiplied by the same day count. ACCA’s ratio analysis guide provides the collection-period and payment-period framework and identifies cost of sales as a possible purchase proxy.
Trade receivables arise from customers; trade payables arise from suppliers. A total liabilities line can include borrowing, taxes and other amounts unrelated to the purchase denominator. Similarly, a broad receivables line may contain loans or other balances unrelated to the sales being analyzed. Read the notes before copying totals.
Calculate two equal day counts
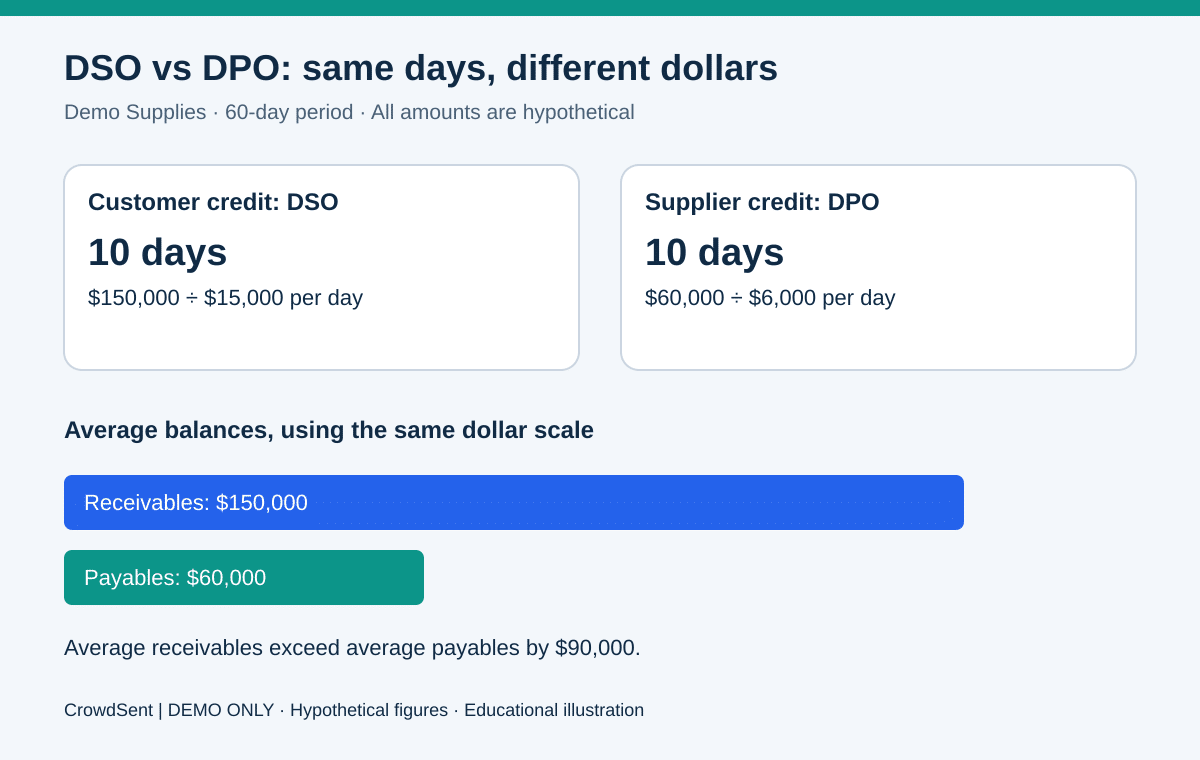
Demo Supplies has opening trade receivables of $120,000 and closing receivables of $180,000. The simple average is ($120,000 + $180,000) ÷ 2 = $150,000. Its credit sales over 60 days are $900,000. DSO is $150,000 ÷ $900,000 × 60 = 10 days.
Opening trade payables are $50,000 and closing payables are $70,000, giving a $60,000 average. Credit purchases total $360,000. DPO is $60,000 ÷ $360,000 × 60 = 10 days. The two ratios match, yet average customer credit exceeds supplier credit by $90,000.
The explanation is visible in the daily flows. Daily credit sales are $15,000, while daily credit purchases are $6,000. Ten days of each produces $150,000 and $60,000 respectively. Subtracting day counts does not cancel the underlying dollar balances.
The DSO vs DPO example also shows why one day of faster collections and one day of later payments have different modeled cash effects. Holding the stated flows constant, the first changes average receivables by $15,000; the second changes average payables by $6,000. These are sensitivity estimates, not forecasts of realizable savings.
Watch what happens when the denominator changes
Suppose the business also made $300,000 of immediate-payment sales. Total sales would be $1.2 million. Using that total instead of $900,000 of credit sales produces $150,000 ÷ $1.2 million × 60 = 7.5 days. No customer paid any earlier; only the denominator changed.
Now suppose cost of goods sold was $300,000 and inventory increased by $60,000. In this simplified merchandise-only example, purchases equal cost of goods sold plus the inventory increase: $360,000. Using cost of goods sold directly produces a 12-day DPO, compared with the purchase-based 10 days.
The simplified purchase bridge assumes no write-downs, acquisitions, foreign-exchange movements or other inventory adjustments. A manufacturer also has conversion costs that complicate the link to supplier purchases. When purchase information is unavailable, a labeled proxy can still help, provided comparisons retain the same method.
Connect averages with actual invoices
A reported 10-day DSO does not establish that every customer has 10-day payment terms. One customer might pay immediately while another remains overdue. An aging schedule separates outstanding invoices into time bands and helps test what an average conceals. ACCA’s discussion of trade receivables explains why an amount billed and the amount ultimately recoverable can differ.
Consider two hypothetical ledgers with the same $150,000 closing balance. One contains recent invoices to many customers; the other contains a large disputed invoice from months earlier. The DSO formula cannot reveal that difference by itself. Customer concentration, disputes and subsequent receipts add information that a ratio lacks.
Likewise, distinguish agreed supplier terms from overdue payments. The same DPO can represent a routine month-end settlement or financial pressure. ACCA’s cash-flow analysis guide discusses why increased payables may reflect delayed payments. Payment timing should be read together with terms, supplier relationships and any financing arrangements.
Make DSO vs DPO comparisons reproducible
Keep the averaging frequency, credit-versus-total-sales choice and purchase proxy visible. Opening and closing balances are convenient, but daily or monthly averages can better capture uneven activity. Do not compare an average-balance calculation with an ending-balance company metric as if they were identical.
Finally, record changes in business mix. More immediate-payment sales, a newly acquired operation or a seasonal billing peak can move DSO without a change in collection procedures. The ratio is a starting question: which balances and flows changed, and what evidence explains the movement?
Frequently asked questions
1. What does DSO stand for?
Days sales outstanding. In this article it measures average trade receivables relative to credit sales, expressed using the number of days in the reporting period.
2. What does DPO stand for?
Days payable outstanding. Here it measures average trade payables relative to credit purchases; some published calculations use cost of goods sold as a proxy.
3. Do matching DSO and DPO fund all customer credit?
No. The example has 10 days for each but $150,000 of receivables and only $60,000 of payables. The denominators represent different daily dollar flows.
4. Can I use total revenue for DSO?
You can report a clearly labeled total-revenue version when appropriate data are unavailable. Immediate-payment sales can make it lower than an otherwise identical credit-sales calculation.
5. Why might purchase-based DPO differ from cost-based DPO?
Purchases and cost of goods sold differ when inventory changes. Other adjustments and manufacturing costs can make the relationship more complicated than a simple inventory bridge.
6. Does lower DSO prove better collections?
No. Changes in sales mix, the averaging window or receivable measurement can affect it. Check invoice aging and actual receipts before concluding collection behavior improved.
7. Is a receivable allowance relevant?
Yes. Gross and net balances can produce different results. Record which is used, and inspect the allowance separately rather than letting a write-down masquerade as collection.
8. Should sales tax be included?
Use internally consistent balances and flows. If receivables include tax while reported revenue excludes it, document the mismatch or adjust using reliable disclosed information.
9. Can these ratios use a month rather than a year?
Yes. Match the month’s flows, a representative balance average and the month’s day count. Seasonal comparisons generally need equivalent windows and a consistent calculation.
10. What is the most useful supporting record?
An invoice aging analysis with agreed terms and subsequent payments. It shows who owes what, how long amounts remain outstanding and whether the aggregate ratio hides exceptions.
Keep the source date, units, reporting boundary and calculations together in a market research journal so later comparisons can be reproduced.
Sources and further reading
Educational examples only. Figures are hypothetical and do not provide investment, tax or accounting advice.
Explore CrowdSent membership.