

Chain-linked volume nonadditivity means separately calculated real components generally do not sum to their published real aggregate. A spreadsheet can add the displayed numbers correctly and still produce an economically inappropriate total. The difficulty comes from the index construction and changing relative prices.
BEA’s chained-dollar definition explains that these measures preserve a series’ growth while losing general additivity outside the reference period. Understanding that trade-off helps readers avoid mistaken shares and misleading contribution calculations.
Chain-Linked Volume Nonadditivity: begin with a completely specified demonstration
Consider an imaginary economy with exactly two final products, A and B, no intermediate inputs and no other components. In year zero, it produces 100 units of each. Each unit costs one currency unit, so current-price output is 200. Use year zero as the reference year.
In year one, A’s quantity falls to 50 while its price rises to two. B’s quantity rises to 200 while its price falls to one-half. Current-price output remains 200: A contributes 50 times two, or 100, and B contributes 200 times one-half, also 100.
These unusually large changes are deliberate teaching inputs. They are not observations from any country. We will calculate the aggregate using a Fisher quantity index rather than stipulate an arbitrary total and call its difference nonadditivity.
Calculate the aggregate from both price sets
A Laspeyres quantity ratio values both years’ quantities at year-zero prices. Year one’s quantities then cost 50 plus 200, or 250. Dividing by year zero’s 200 gives a quantity ratio of 1.25.
A Paasche quantity ratio values both sets of quantities at year-one prices. The numerator is year one’s current value, 200. The denominator is the old quantities valued at new prices: 100 times two plus 100 times one-half, or 250. This gives a ratio of 0.80.
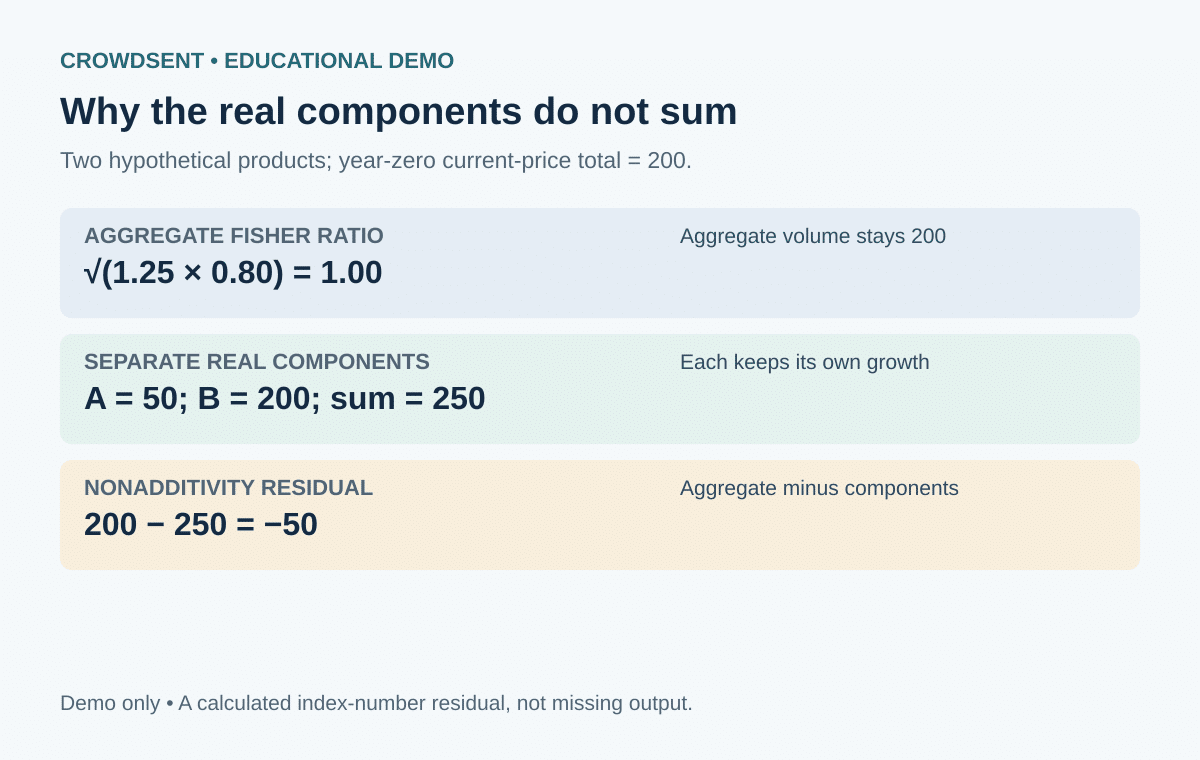
BEA’s Fisher-index glossary defines the Fisher result as the geometric mean of the Laspeyres and Paasche indexes. Here, the square root of 1.25 multiplied by 0.80 equals one. Aggregate volume growth is therefore zero, and the aggregate chained value remains 200. This is one adjacent-period link; a longer series connects successive links.
Now calculate each component separately
For a single unchanged-quality product, its quantity ratio directly describes its volume movement. A’s quantity halves, so its reference-scaled component value falls from 100 to 50. B’s quantity doubles, so its corresponding value rises from 100 to 200.
The separately calculated chain-linked volume components now sum to 250. The aggregate calculated above is 200. Using aggregate minus component sum as the residual convention, the residual is minus 50. All three values follow the stated calculations; there is no omitted third product.
The reason is that adding the component values in reference-year currency units effectively uses the old relative-price structure. The aggregate Fisher calculation uses information from both price sets. Those operations need not produce the same answer when relative prices and quantities change.
Keep the residual separate from measurement disagreement
BEA’s GDP statistical conventions describe nonadditivity residuals in chained-dollar tables. Such a residual reflects the relationship between an aggregate and separately chained components. It should not be read as an amount of output that someone forgot to count.
It is also different from the statistical discrepancy between GDP and GDI, which concerns estimates built from different source information. A source-data disagreement and an index-number aggregation property answer different questions, even when both appear as a difference in a table.
Ordinary rounding can create small gaps too. Before explaining any mismatch, read the table notes and confirm the units, signs and component coverage. A real-world table may contain both rounding effects and a documented nonadditivity residual.
Use the right tool for shares and contributions
In our example, each product represents 100 of the current-price total of 200, a 50 percent share. Dividing chained components by the chained aggregate would instead produce 25 percent for A and 100 percent for B, totaling 125 percent. That total reveals why the latter calculation is unsuitable as a spending-share breakdown.
BEA’s guidance on chained-dollar indexes recommends current-dollar shares for relative importance and appropriate contribution measures for growth analysis. A component’s own growth rate and its contribution to aggregate growth are distinct statistics.
For a custom chain-linked volume aggregate, adding published chained levels is generally insufficient. Use an official matching aggregate when available. Otherwise, reconstruct it with the required current-price information and documented index methodology. This demonstration uses Fisher arithmetic; national statistical systems can use other chain-linking methods and have different limited cases of additivity.
Questions about chain-linked volume nonadditivity
1. Does nonadditivity mean the published GDP total is wrong?
No. The total and components can each be correct under their respective index calculations. The error would be assuming their reference-scaled levels must always add.
2. Why do components add in the reference year?
Their chained values are normalized to their current-price values in that year. For a correctly specified additive current-price breakdown, that reference-year normalization restores the matching total.
3. Can I force the residual into one component?
That would change the meaning of the component. Unless an official method explicitly calls for an adjustment, retain the residual and explain it separately.
4. Is the minus 50 in this example a lost payment?
No. It is 200 minus 250 under the specified index calculation. Current-price payments still total 200, and the example contains no missing transaction.
5. Can two perfectly measured products generate nonadditivity?
Yes. This demonstration assumes every price and quantity is known exactly. The difference arises from aggregation, without sampling error or incomplete reporting.
6. Is a chained value the number of physical units?
Usually it is a reference-scaled volume measure. Physical units for unlike products cannot simply be added into a meaningful economy-wide quantity.
7. Can I subtract real imports from real exports to build a real trade balance?
Do not assume separately chained levels support that subtraction. Prefer the publisher’s defined aggregate or contribution measures and read its methodological notes.
8. Will changing the reference year eliminate every residual?
It changes the scaling and can make components additive in the new reference year. It does not generally restore additivity throughout the entire time series.
9. How should a chart show contributions to GDP growth?
Use the official percentage-point contribution series for the same period and convention. Do not substitute changes in chained component levels without a valid decomposition method.
10. What must accompany a custom real aggregate?
Document its components, prices or weights, index formula, linking frequency, reference year and data vintage. Without these, another reader cannot reliably reproduce the result.
Educational note: All numerical examples are hypothetical demonstrations. This article explains economic statistics and does not provide investment advice or predict market returns.
Explore CrowdSent membership.
Keep the source date, units, reporting boundary and calculations together in a market research journal so later comparisons can be reproduced.