

The cash conversion cycle estimates how long operating cash is committed between paying suppliers and collecting from customers. It combines three timing measures: days inventory outstanding, days sales outstanding and days payable outstanding. Reading those pieces together is more useful than treating the final number as a score.
This article follows a fictional distributor through a 90-day reporting period. Every amount is a demo. The purpose is to understand timing, input choices and limitations, rather than rank investments or prescribe a supplier-payment policy.
Build the cash conversion cycle from three clocks
The usual calculation is inventory days plus receivable days minus payable days, often written CCC = DIO + DSO − DPO. Inventory days cover stock held before sale. Receivable days describe the collection interval. Payable days represent supplier financing and are subtracted. ACCA’s working capital guide explains this cash operating cycle framework.
The result is expressed in days. It does not state the bank balance, the amount of borrowing required or the return on the goods. Payroll, rent, tax and many other payments sit outside this three-part approximation. Even a carefully measured cycle therefore belongs beside a fuller cash forecast.
Work through a 90-day distributor example
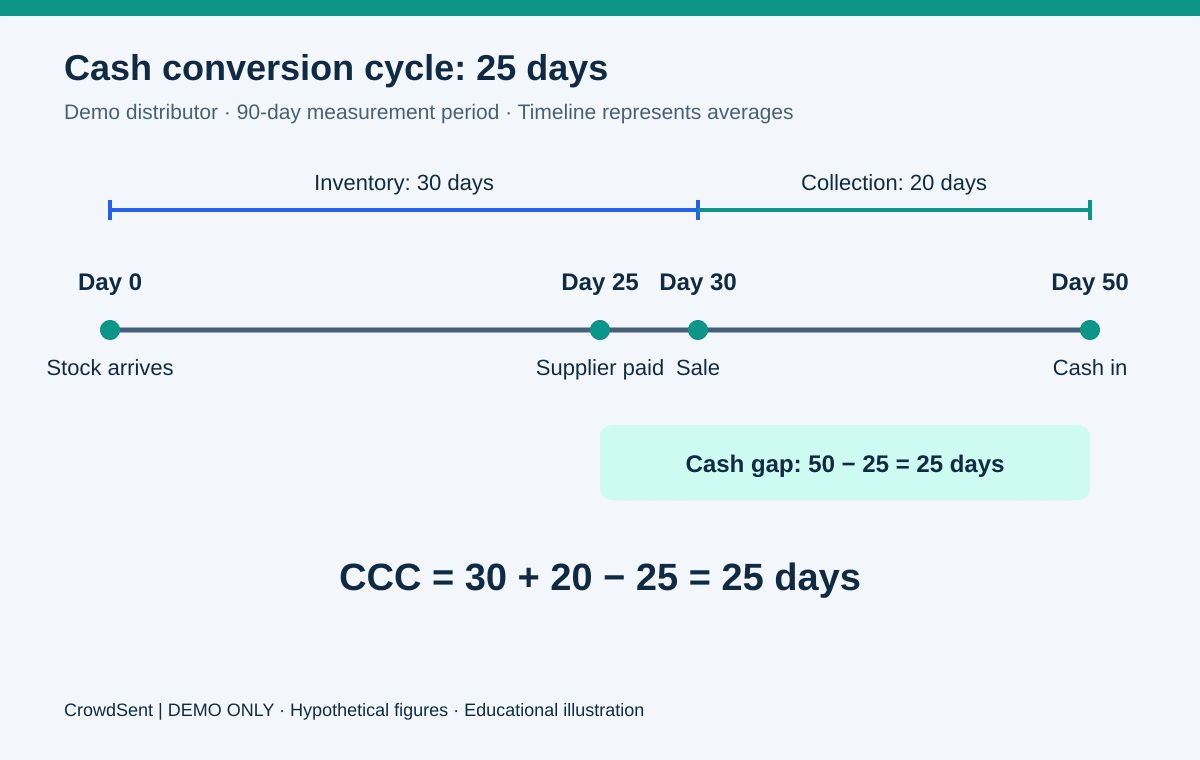
Assume Demo Distribution reports $900,000 of credit sales and $540,000 of cost of goods sold during 90 days. Credit inventory purchases also total $540,000. Average inventory is $180,000, average trade receivables are $200,000 and average trade payables are $150,000. These averages are stipulated as representative of the period.
Inventory days equal $180,000 divided by $540,000, multiplied by 90: 30 days. Receivable days equal $200,000 divided by $900,000, multiplied by 90: 20 days. Payable days equal $150,000 divided by $540,000, multiplied by 90: 25 days.
The cash conversion cycle is therefore 30 + 20 − 25 = 25 days. On an illustrative transaction timeline, stock arrives on day zero, the supplier is paid on day 25, the stock sells on day 30 and the customer pays on day 50. The cash gap runs from day 25 to day 50.
The timeline translates an average into a picture; it does not claim every invoice follows that path. Some goods may sell immediately while others remain for months. A single customer could pay far later than the calculated 20 days. The aggregate numbers compress those differences.
Explain a change before celebrating it
Suppose the next comparable period shows inventory days of 26, receivable days of 22 and payable days of 28. The new cycle is 20 days. Its five-day decline comprises a four-day inventory improvement, a two-day collection slowdown and three additional days of supplier financing: −4 + 2 − 3 = −5.
That bridge changes the questions a reader asks. Was the inventory reduction planned, or did shortages prevent deliveries? Did customers receive longer agreed terms, or did overdue invoices rise? Were supplier terms renegotiated, or were invoices simply paid late? These are different explanations for the same headline movement.
ACCA’s cash-flow analysis discussion highlights why a rise in payables can warrant attention when interpreting cash generation. A shorter cycle produced by overdue bills can carry costs that the ratio itself never displays. Supporting payment terms and aging schedules are more informative than a universal target.
Understand a negative result
Consider a second demo with inventory days of 12, receivable days of two and payable days of 30. The result is −16 days. In the simplified timeline, customers pay before suppliers are paid. This can occur in businesses with fast sales and immediate customer payment.
A negative result does not erase obligations. If the business contracts, incoming sales cash can fall while earlier supplier bills still mature. Nor does the sign establish profit: a business can sell quickly at an inadequate margin. Timing and the economics of each sale answer separate questions.
Keep the measurement boundary consistent
Use balances and flows from the same business, period and currency. A 90-day revenue denominator requires a 90-day multiplier. A full-year denominator requires the relevant full-year day count. Mixing quarterly sales with 365 days would inflate this example’s collection estimate by roughly four times.
Definitions also differ across reports. Historical SEC-hosted issuer correspondence provides a concrete example of a company specifying daily sales, cost and inventory-change inputs. Copying a published CCC without its methodology can conceal a denominator change. Save the formula, averaging method and any estimated inputs beside the result.
Finally, seasonal peaks may disappear in opening-and-closing averages. Acquisitions, inventory write-downs and receivable sales can also move ratios without representing a comparable operating improvement. The strongest reading identifies what changed, why it changed and which parts of that explanation remain unverified.
Frequently asked questions
1. Is the cash conversion cycle a cash balance?
No. It is a duration estimate assembled from operating ratios. A 25-day cycle does not mean the business has 25 days of cash available.
2. Why is payable time subtracted?
Supplier credit delays the business’s own cash payment. In the demo, 25 supplier-financed days reduce the 50-day inventory-and-collection interval to a 25-day gap.
3. Can the cycle be negative?
Yes. If supplier payment follows customer collection, payable days exceed inventory plus receivable days. The outstanding supplier obligations still need to be paid.
4. Does a zero-day cycle mean no funding is needed?
No. Other operating payments, investment spending and uneven daily flows can create funding needs even when this particular average is zero.
5. Which period length should I use?
Use the day count matching the flows in the denominator. State whether the analysis uses actual calendar days, 365 days or another disclosed convention.
6. Why can two providers report different cycles?
They may use different balance averages, sales periods, purchase proxies or trade-balance exclusions. Compare the inputs before attributing the difference to business performance.
7. Is a shorter cycle always an improvement?
Its cause matters. Fewer obsolete items and prompt collections differ from stock shortages, expensive discounts or overdue supplier bills, even if the number falls.
8. Can this measure describe a service company?
Sometimes, but inventory may be negligible and billing milestones can dominate. Adapt the interpretation to the business instead of assuming a distributor’s timeline fits.
9. Should I multiply cycle days by daily sales?
That shortcut mixes cost-based and revenue-based components. Estimate cash tied up in each component separately using the flow that matches its balance.
10. What should accompany a saved calculation?
Keep reporting dates, average balances, denominator definitions, day counts and a bridge explaining changes. Label proxies so a later reader can reproduce the result.
Keep the source date, units, reporting boundary and calculations together in a market research journal so later comparisons can be reproduced.
Sources and further reading
- ACCA: Working capital management
- ACCA: Analysing a statement of cash flows
- SEC-hosted McCormick correspondence, March 2010
Educational examples only. Figures are hypothetical and do not provide investment, tax or accounting advice.
Explore CrowdSent membership.