

Annualized growth vs year-on-year is a comparison of time windows. An annualized quarterly rate expresses the latest quarter’s pace as if it repeated for four quarters. A year-on-year quarterly rate compares the latest level with the same quarter one year earlier. They can tell different stories without either calculation being wrong.
The most useful first step is to identify the two observations used. Words such as annual, yearly and annualized are too easily shortened into an ambiguous label. The worked examples below use hypothetical, consistently adjusted real GDP indexes.
Annualized Growth vs Year-on-Year: read the latest quarter in two ways
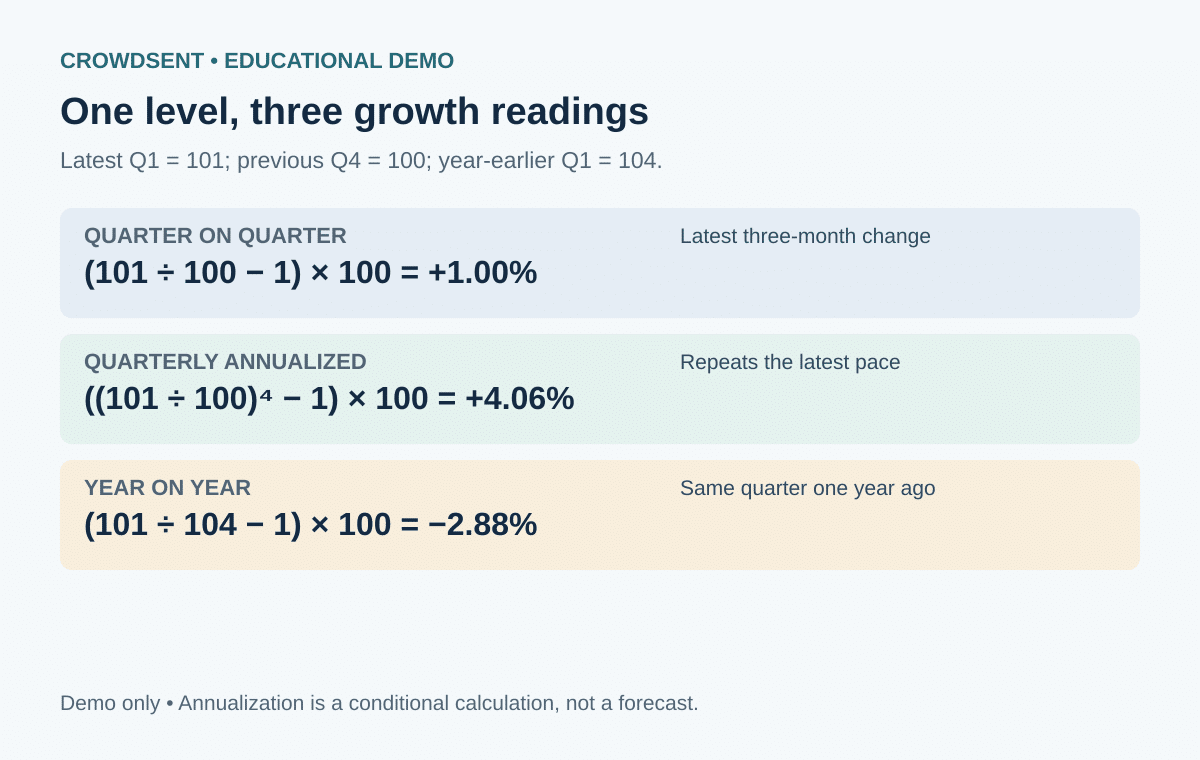
Imagine last year’s quarterly GDP indexes were 104, 103, 102 and 100. This year’s first quarter is 101. Relative to the immediately preceding quarter, GDP rose from 100 to 101, a 1 percent increase. This is the ordinary quarter-on-quarter rate.
BEA’s explanation of annualized quarterly growth uses compounding to express that pace over four quarters. Raise 1.01 to the fourth power, subtract one and multiply by 100. The result is 4.0604 percent, normally rounded to 4.1 percent in a one-decimal presentation.
The calculation is conditional arithmetic. It does not mean output actually increased 4.1 percent during the latest three months. It also does not predict that the same pace will continue.
Use the earlier year’s matching quarter
For year-on-year growth, the relevant comparison is 101 against 104. Dividing 101 by 104, subtracting one and multiplying by 100 gives approximately minus 2.88 percent. The economy has improved from the preceding quarter while remaining below its level a year earlier.
That combination is easy to understand once the intervening path is visible. Last year’s three declines moved the index down to 100. This year’s small rebound recovered part of that loss. A single positive quarter cannot, by itself, erase the earlier declines.
Eurostat’s quarterly GDP metadata distinguishes change from the previous period from change against the same period of the preceding year. Keep those labels when moving a statistic into a chart or a headline. Both describe growth, but their starting points differ.
Separate a calendar-year average
There is a third comparison: annual GDP against the preceding year’s annual GDP. For an index illustration, last year’s average level was 102.25, calculated as 104 plus 103 plus 102 plus 100, divided by four.
Now make an explicit hypothetical assumption that the new year’s remaining quarters all equal 101. Its average would be 101, producing annual-average growth of 101 divided by 102.25, minus one, or approximately minus 1.22 percent. This scenario has a positive first-quarter annualized rate, zero subsequent quarterly growth and a negative annual-average comparison.
This exercise demonstrates the influence of the starting path. It is not a forecast. Calculating an annual result from actual data requires the publisher’s consistent annual series and conventions, rather than casually averaging four rounded growth percentages.
Do not annualize the level twice
A quarterly GDP level may already be expressed at an annual rate. BEA’s guide to annual-rate levels explains this scaling convention. A hypothetical seasonally adjusted quarterly flow of 500 billion can be displayed as 2,000 billion at an annual rate.
If the next quarter’s flow is 505 billion, its annual-rate level is 2,020 billion. Either pair gives 1 percent quarter-on-quarter growth: 505 divided by 500 equals 2,020 divided by 2,000. Annualizing the growth still requires compounding that ratio. Multiplying the already annual-rate level by four again would misstate its units.
The distinction is between scaling a flow and compounding a change. They use different operations, even though both can appear beside the words annual rate. Record the original units before transforming either number.
Reverse the calculation carefully
To recover a quarterly change from an annualized percentage, convert the percentage to a decimal, add one, take the fourth root and subtract one. An annualized 4.0604 percent therefore returns 1 percent per quarter. BEA’s growth-rate methodology identifies frequency and elapsed periods as essential inputs.
Dividing the annualized percentage by four is only an approximation. At a hypothetical minus 10 percent quarterly change, the annualized rate is about minus 34.39 percent, because 0.90 to the fourth power equals 0.6561. Multiplying minus 10 by four would incorrectly give minus 40 percent.
For international annualized growth comparisons, align the interval, real or nominal basis, seasonal and calendar adjustment, and release vintage. Do not compare a country’s annualized quarterly headline directly with another country’s unannualized quarterly headline. Keep both original labels and the transparent conversion alongside the comparison.
Questions about annualized growth vs year-on-year
1. Can annualized growth be positive while year-on-year growth is negative?
Yes. In the demonstration, the latest quarter rebounds from 100 to 101 but remains below the matching year-earlier level of 104. The two signs describe different intervals.
2. Does an annualized rate count the last four quarters?
A one-quarter annualized rate repeats the latest quarter’s growth factor four times. It does not combine the actual growth factors from the preceding four quarters.
3. Which rate is more useful for recent momentum?
Quarter-on-quarter growth isolates the latest comparison. Year-on-year growth supplies a longer reference window. Their usefulness depends on the question and the quality of the underlying series.
4. Can I add four quarterly growth rates to obtain year-on-year growth?
Exact cumulative growth requires multiplying the four successive gross growth factors and subtracting one. Addition is an approximation that becomes less reliable as movements grow.
5. Does annualizing remove seasonal effects?
No. Annualizing changes the rate’s time scale. Seasonal adjustment is a separate treatment of the underlying series; check whether it has already been applied.
6. Why is annual-average growth different from fourth-quarter year-on-year growth?
The annual comparison includes activity throughout both years. Fourth-quarter year-on-year growth uses only the two fourth-quarter levels, so the intervening path affects the comparisons differently.
7. Can I compare rates calculated from different GDP reference years?
Pure index rescaling preserves within-series percentage changes. Other revisions may accompany a new reference year, so compare the actual definitions and data vintages too.
8. What if the source reports monthly growth?
The annualization exponent would generally be twelve for a one-month rate. Do not apply the quarterly fourth-power calculation to a monthly observation.
9. Should a rounded annualized headline reproduce an exact quarterly rate?
Usually only approximately. Rounding removes information. Use the underlying unrounded index or the publisher’s own quarterly-rate series when precision matters.
10. What should a clear chart label contain?
Name the measure, interval and treatment, such as real GDP, quarter-on-quarter annualized percent change, seasonally adjusted. Include the source and release date in the chart notes.
Educational note: All numerical examples are hypothetical demonstrations. This article explains economic statistics and does not provide investment advice or predict market returns.
Explore CrowdSent membership.
Keep the source date, units, reporting boundary and calculations together in a market research journal so later comparisons can be reproduced.